Bollinger Bands in Crypto Explained
Master Bollinger Bands to pinpoint volatility, spot crypto breakouts, and identify optimal entries with chart examples included for BTC, ETH, and other altcoins.

Disclosure: Coinperps may earn a commission from partner links, at no extra cost to you. Reviews are based on independent testing — see how we test.
- Bollinger Bands are a visual trading indicator that uses three adjustable bands to highlight volatility and relative price extremes across different financial assets.
- The bands consist of a central moving average and two outer lines calculated based on standard deviations, reacting dynamically to changes in market volatility.
- In crypto’s volatile trading environment, Bollinger Bands help traders anticipate potential breakouts, reversals, and periods of tightening price action.
Bollinger Bands are one of the few indicators that show both volatility and price extremes with clarity. You’ve likely seen them on charts as three curved lines that stretch and contract as the market shifts.
In crypto, where 10% candles and fake breakouts are common, they help traders spot when price is overextended and when pressure is building for a breakout or reversal.
Here’s everything you need to know about Bollinger Bands, from how they work to how traders apply them on crypto charts, with our favorite trading setups included as a bonus.
What Are Bollinger Bands?
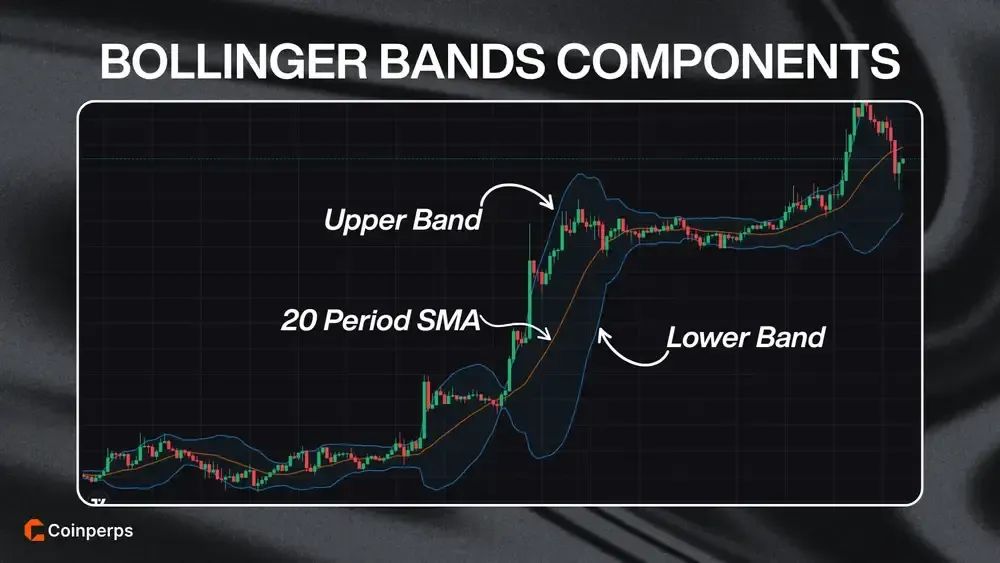
Bollinger Bands are a technical analysis indicator consisting of three lines plotted on a cryptocurrency price chart, forming a band around the asset’s price. Created by John Bollinger in the 1980s, this indicator helps traders measure volatility and identify potential overbought or oversold conditions.
The three lines, or "bands," include the middle band, usually a 20-period simple moving average (20 SMA), tracking the asset's intermediate-term trend. The upper band, plotted above the middle line, adds two standard deviations to the SMA, showing statistically high or overbought price levels.
The lower band, plotted below the middle SMA, subtracts two standard deviations, representing statistically low or oversold conditions. By default, Bollinger Bands use a 20-period SMA and ±2 standard deviations, indicating a crypto asset’s typical price range and volatility shifts through widening or narrowing bands.
How Bollinger Bands Work in Crypto Trading
Crypto traders use Bollinger Bands to measure volatility and identify price levels likely to revert to the mean. The middle moving average band represents short-term market consensus, while the outer bands visually represent volatility limits commonly seen in tokens like Bitcoin or altcoins.
Key concepts traders follow:
- Volatility Expansion and Contraction: Bands widen during high-volume breakouts or price dumps and contract during low-volume consolidations, alerting traders to anticipate directional changes.
- Overbought and Oversold Levels: When a coin hits the upper band, traders view it as overheated, while touching the lower band suggests oversold conditions and possible reversals.
- Mean Reversion ("Bollinger Bounce"): Altcoins often return to the middle band after touching extremes, providing clear price targets when markets trade sideways.
- "The Squeeze" and Breakouts: Extremely tight Bollinger Bands ("squeezes") typically precede breakouts, helping traders prepare for directional shifts in coins like ETH or XRP.
- Trending "Walking the Bands": Assets in strong uptrends or downtrends, such as SOL or BNB, often remain along an outer band for extended periods, pointing to bullish or bearish momentum.
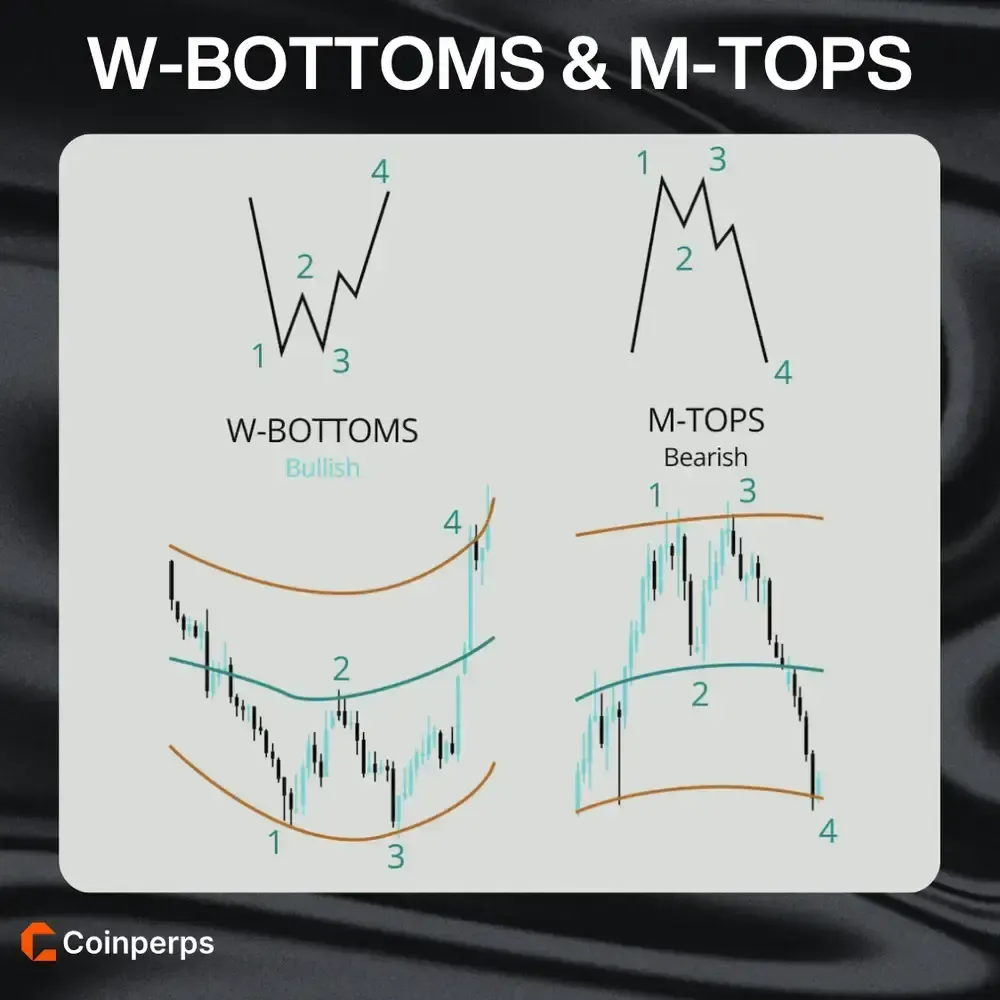
- Double Bottoms and Tops: Bollinger Bands visually highlight reversal patterns like W-bottoms or M-tops, revealing trend reversals for traders.
Bollinger Bands Example
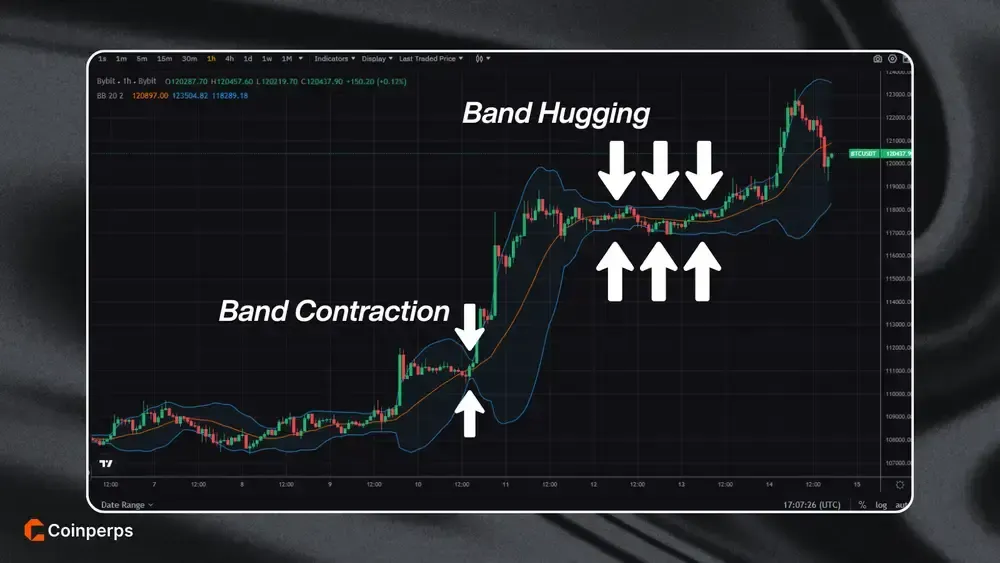
The chart below shows BTC/USDT on the 1-hour timeframe, covering the period from July 6 to July 14, 2025. For several days, Bitcoin traded sideways between roughly $117,000 and $119,000, causing the Bollinger Bands to contract as volatility dropped.
On July 10, BTC broke above the upper band and rallied past $123,000, suggesting a volatility expansion and the start of a strong uptrend. As the rally continued, price "walked the bands," hugging the upper edge while the bands widened, confirming momentum.
On July 14, price spiked above the upper band and then reversed, falling back toward the middle band near $120,000. This behavior highlights how Bollinger Bands can predict both breakout strength and potential exhaustion when price stretches too far from the average.
How to Set Up Bollinger Bands on TradingView
Setting up Bollinger Bands is very simple on TradingView or any crypto exchange utilizing TradingView charts (such as Bybit, Binance, KuCoin, etc.). Here’s exactly how to add Bollinger Bands to your crypto charts:
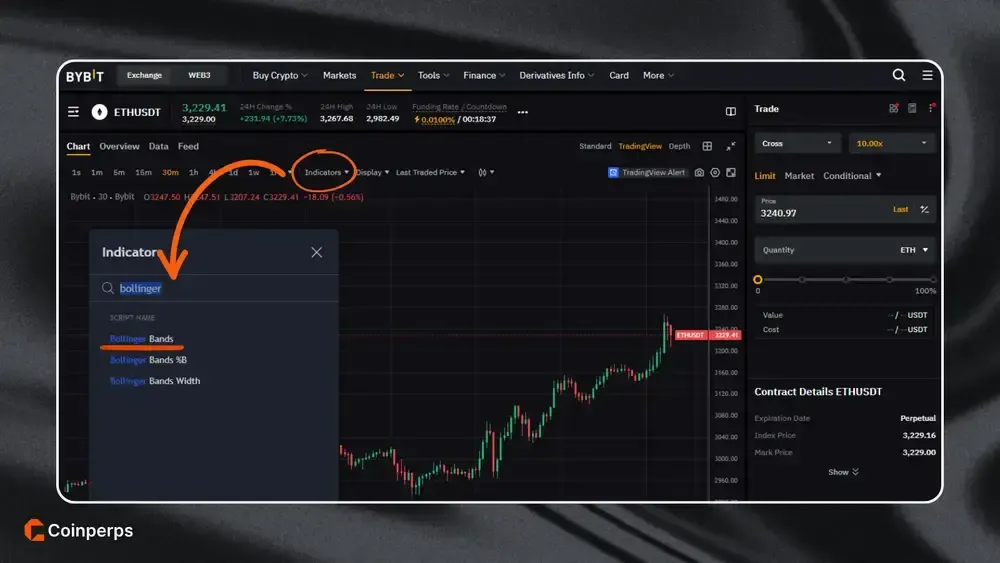
- Open the Chart: Launch the cryptocurrency chart (e.g., BTC/USD or ETH/USDT) on TradingView or your exchange’s advanced chart view with indicator options.
- Access Indicators Menu: Click the "Indicators" button (often labeled "Indicators" or marked by an ƒx icon) located near the top of your chart to open the indicators dialog.
- Find Bollinger Bands: Type "Bollinger Bands" into the indicator search bar and select the standard indicator typically listed as "Bollinger Bands (20, 2)" in the search results.
- Add Indicator to Chart: Click the indicator name to instantly overlay the Bollinger Bands on your price candles, displaying upper, middle, and lower bands.
- Adjust Default Settings (Optional): Default settings are typically 20-period SMA and 2 standard deviations, but you can customize these parameters (e.g., adjust period to 21 or standard deviations to 1.5) by clicking the ⚙️ settings icon next to the indicator's name.
- Customize Visual Style (Optional): Use the "Style" tab in the settings menu to adjust band colors and thickness, ensuring the Bollinger Bands are clear and visually distinct on your chart.
- Save Chart Layout (Optional): If supported, save your customized chart layout with Bollinger Bands enabled on TradingView or exchanges like Bybit, making the setup easily reusable for future analysis.
Common Bollinger Band Strategies for Crypto Traders
Now that we understand Bollinger Bands, how do crypto traders practically apply them in trading? Below are several common strategies used in various market conditions.
Bollinger Bounce (Range Trading)
This approach performs best when crypto prices are trading within a clear, sideways range:
- Buy Low, Sell High: Enter trades by purchasing crypto near the lower Bollinger Band, expecting a reversal upward, and sell near the upper band anticipating a pullback.
- Middle Band as a Target: Take partial profits or exit trades when price returns to the middle band (20 SMA), ensuring you lock in gains safely.
- Identify Flat Bands: Confirm that Bollinger Bands are horizontal and flat, showing stable highs and lows suited for this bounce strategy.
- Set Protective Stop-Loss: Always place stop-loss orders outside the range boundaries in case price breaks out rather than reversing as expected.
Bollinger Squeeze (Volatility Breakout)
This strategy identifies periods of low volatility ("squeeze") to capitalize when volatility inevitably expands.
- Spot the Squeeze: Look for prolonged periods where Bollinger Bands narrow tightly, highlighting potential explosive price action approaching.
- Wait for Confirmed Breakouts: Only enter trades after price decisively closes outside either band, confirming the breakout's direction.
- Check Volume to Confirm: Confirm authenticity of breakouts by observing increased volume during price breaks beyond the bands, reducing the risk of false alerts.
- Ride the Volatility Expansion: Once in the trade, use the expanding bands as a guide to maintain your position until volatility subsides or price re-enters the bands sharply.
Riding the Bands (Trend Trading)
In strong trends, Bollinger Bands help traders manage active trades, recognizing sustained momentum rather than being an indicator for immediate reversals.
- Identify Strong Momentum: Recognize ongoing trends when price repeatedly touches or remains just outside the upper band (bullish) or lower band (bearish), indicating continued strength.
- Use Middle Band as Trailing Support: In bullish trends, trail your stop-loss or manage positions around the middle band (20 SMA), staying in the trade as long as price remains above it.
- Watch for Momentum Weakness: Notice when price frequently re-enters the bands or when bands start flattening, suggesting that momentum may be slowing, prompting position reduction or exit.
Combining Bollinger Bands with Other Indicators
Traders often boost the accuracy of Bollinger Bands by integrating additional technical indicators.
- Confirm with RSI (Relative Strength Index): Pair Bollinger Bands with RSI; if price touches the lower band and RSI indicates oversold conditions, this strengthens confidence in a potential reversal upward.
- Use Volume to Validate Breakouts: Observe rising volume (with VPVR for example) when price pierces an outer band, confirming a breakout is backed by strong market participation and conviction.
- Pair with MACD Crossovers: Confirm Bollinger Band breakouts by combining them with bullish or bearish MACD crosses, enhancing confidence that momentum is genuinely shifting.
- Moving Average Crossovers: Combine Bollinger Bands with moving average crossovers to identify trend changes or continuations, ensuring stronger, multi-layered confirmations.
Pro Tips for Using Bollinger Bands
Having used Bollinger Bands extensively across various crypto markets, our trading team has learned several key lessons. Keeping these pro tips in mind will help you maximize the indicator’s effectiveness.
Always identify the market regime before trading: in sideways markets, band touches confirm reversals ideal for Bollinger Bounce trades. Check the slope and angle of bands; flat slopes indicate range-bound conditions, whereas steep slopes suggest ongoing trends.
To avoid false entries, always use confirmation to filter Bollinger Band signals instead of relying solely on the bands. For instance, verify an overbought asset with oscillators like RSI, or confirm squeezes by awaiting volume spikes or MACD crossovers for validating breakouts.
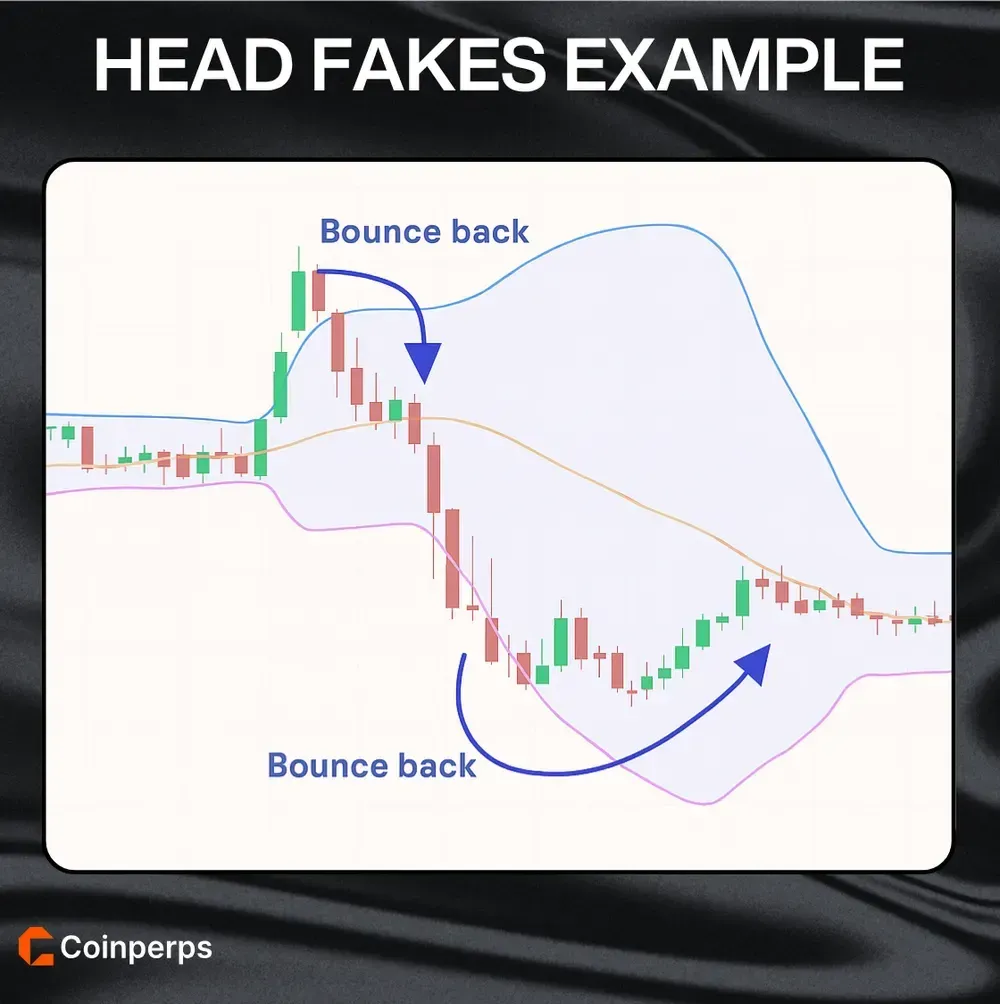
Be especially cautious of "head fakes", where price briefly pierces a band before quickly reversing, creating false breakouts. Implement a rule such as waiting for three consecutive candles to close outside the bands, reducing the risk of entering trades prematurely.
Risks and Limitations of Bollinger Bands in Crypto
Understanding potential risks is essential when trading crypto using Bollinger Bands. While effective in measuring volatility, no indicator guarantees successful trades, and you should be mindful of common pitfalls.
Key risks for this indicator include:
- False Breakouts: Prices frequently swing beyond bands briefly before reversing, potentially causing premature entries or exits.
- Misreading Market Conditions: Mistaking trending conditions for range-bound markets (or vice versa) can lead to misplaced trades and losses.
- Overreliance on Bands Alone: Using Bollinger Bands without confirmation from other indicators immensely increases risk of misleading trade setups.
- Ignoring Market Momentum: Assuming immediate reversals in strong trending markets often results in trading against powerful price momentum.
- Inappropriate Band Settings: Choosing unsuitable Bollinger Band parameters (period length or deviation multiplier) can generate deceptive signals, especially in volatile crypto markets.
Bottom Line
Bollinger Bands translate abstract concepts of volatility and relative price into visual cues directly on your crypto charts. As professional traders, we rely on them to highlight critical moments: a market tightening up, price hitting extremes, or a strong trend-building momentum.
They don’t offer absolute buy or sell signals, but they show precisely when to pay closer attention. With practice, proper confirmation, and disciplined risk management, Bollinger Bands can become an essential part of your trading approach, helping you navigate crypto volatility with greater confidence.