What is Cumulative Volume Delta (CVD)?
Find out how Cumulative Volume Delta (CVD) reveals real-time buying and selling pressure in crypto markets and how to use it effectively in your trading.

Disclosure: Coinperps may earn a commission from partner links, at no extra cost to you. Reviews are based on independent testing, see how we test.
- What CVD Measures: CVD tracks the net difference between buy and sell volume over time, showing whether aggressive buyers or sellers are in control.
- How to Use It: Use CVD to confirm breakouts, spot divergences, and detect hidden accumulation or distribution not visible through price alone.
- Why It Matters in Crypto: On platforms like Binance and Bybit, CVD helps decode real-time sentiment by revealing where the true market pressure is coming from.
What is Cumulative Volume Delta (CVD) in Trading?
Cumulative Volume Delta (CVD) is a trading indicator that tracks the net difference between buying and selling activity in real time. Unlike basic volume charts that show total volume, CVD splits volume into buys and sells and accumulates the net result over time.
Each bar’s Delta is calculated by subtracting Sell Volume (orders filled at bid) from Buy Volume (orders filled at ask) for that period. This Delta value is then added to a running total, forming the CVD line, which rises when net buying occurs and falls when net selling dominates.
The result is a line that reflects aggressive market behavior (buyers lifting offers or sellers hitting bids) providing a clearer view of order flow strength. Because it captures only executed market orders, CVD reveals active trader sentiment and helps identify whether bulls or bears are in control behind the scenes.

How to View CVD on TradingView
Cumulative Volume Delta is available on TradingView, even with a free plan. You just need to register an account, and you’ll be able to access a range of professional and community-built CVD indicators.
Here are the steps to get it set up:
- Register or log in: Visit tradingview.com and sign up for a free account or log in to your existing one. This gives you access to indicators and chart-saving features.
- Choose a proper symbol: Search for a futures pair like BTCUSDT from Binance Futures. Avoid using TradingView’s default BTC/USD feed, as it lacks the order flow data required for CVD.
- Add the CVD indicator: Click “Indicators” and type “Cumulative Volume Delta” in the search bar. Select the official TradingView version for reliable, built-in functionality.
- Adjust and read the chart: The CVD line will appear in a pane below your main price chart. You can customize its style, scale, and source depending on your preferences.
- Save your layout: Use the layout saving feature to keep your CVD setup across different pairs and sessions. This makes it easier to monitor order flow on multiple markets.
Note: CVD does not work on embedded TradingView charts found on most centralized exchanges or DEXs like Hyperliquid. For full indicator access, use the standalone TradingView platform and do your TA there.

Why CVD Matters for Buying/Selling Pressure?
Cumulative Volume Delta (CVD) matters because it quantifies order flow, e.g. the real-time battle between buyers and sellers using market orders. It tracks whether aggressive buyers are lifting offers or aggressive sellers are hitting bids, offering a direct read on buying or selling pressure.
In order flow terms, trades at the ask represent buyers taking initiative, while trades at the bid signal sellers pushing the market down. CVD sums this pressure over time, revealing whether buyers or sellers have dominated the tape, even when price appears flat.
This matters because price alone doesn’t show who’s in control, but CVD does. It exposes whether moves are driven by real intent (market orders crossing the spread), helping traders spot hidden strength, weakness, or absorption behind every price shift.

CVD in Crypto Markets vs. Traditional Futures
Originally popular among futures traders in traditional markets, Cumulative Volume Delta has now become a staple for many crypto traders, especially in the crypto derivatives arena (perpetual swaps, futures). Here’s how CVD is used in crypto and how it parallels traditional order flow analysis:
CVD in Crypto Markets
Crypto traders use CVD to analyze the flow of aggressive orders across major exchanges, providing insight into who is controlling the market.
- Trade data: Crypto exchanges like Binance, Bybit, and Deribit stream each executed trade with price, size, and direction (bid or ask).
- CVD tools: Platforms like Coinalyze, Coinglass, and TradingView calculate and plot CVD based on this raw trade data.
- Exchange-specific behavior: Traders monitor CVD per exchange to detect buying or selling dominance unique to each venue.
- Institutional signals: A strong positive CVD on Deribit, for example, may suggest accumulation by larger, institutional players.
- Aggregated view: Some tools combine CVD across exchanges to show overall market pressure, though this masks exchange-level divergence.

CVD in Traditional Futures
In traditional finance, CVD has long been a go-to indicator for professional futures traders looking to track aggressive flows and institutional participation.
- Volume delta: Futures traders use delta (buy volume minus sell volume) to understand short-term pressure in markets like oil or equity indices.
- Footprint charts: Tools like footprint or tape charts display per-bar CVD and help visualize order flow at each price level.
- Real-time depth: Futures platforms offer DOM (Depth of Market) data that pairs with CVD to reveal where large traders are active.
- Method overlap: Crypto traders borrow these same tools and concepts, adapting them for 24/7 markets with fragmented liquidity.
- Core insight: In both crypto and TradFi, CVD serves as an x-ray of market intent, showing whether bulls or bears are truly in control.

Practical Strategies for Using CVD in Trading
Knowing what CVD is and what it indicates is one thing. Applying it in real trading decisions is where the real value lies. CVD shines when used to detect hidden momentum shifts, validate price moves, and uncover stealth accumulation or distribution during consolidation.
Spotting Divergences Between CVD and Price
CVD divergences are early warning signals that buyers or sellers are losing conviction, even if price hasn’t turned yet.
- Bullish divergence: Price makes a lower low, but CVD prints a higher low. This suggests aggressive selling is weakening and buyers may be absorbing the drop, hinting at a possible reversal.
- Bearish divergence: Price pushes to a higher high while CVD forms a lower high. This indicates that aggressive buyers are fading and momentum may be stalling as sellers begin to step in.
- Practical tip: Don’t trade based on divergence alone. Wait for confirmation like a trendline break, candlestick reversal, or market structure shift near key levels.
- Multi-timeframe use: A divergence on a higher timeframe like 4H holds more weight. Intraday divergences can still be useful for scalping if they align with the broader trend.
- Real example: In early May 2025, Bitcoin hit a high of $97-98k while CVD failed to confirm. This showed weak underlying buy pressure and the price corrected soon after.

Confirming Breakout or Reversal Strength
CVD helps verify if a breakout or reversal is supported by actual order flow or if it is likely to fail.
- Breakout confirmation: A strong CVD spike during a breakout signals real aggressive buyers stepping in. This supports entering or holding a long position with more confidence.
- Reversal confirmation: If price forms a bottom and CVD starts rising before the reversal. This means buyers were already stepping in, confirming strength behind the move.
- Rule of thumb: CVD and price should move in the same direction to confirm strength. If they diverge, the move may lack true conviction.
- Example reversal: Bitcoin falls to $85k, then CVD rises even before the price turns up. This suggests strong hands are absorbing the drop, making it a more credible reversal.
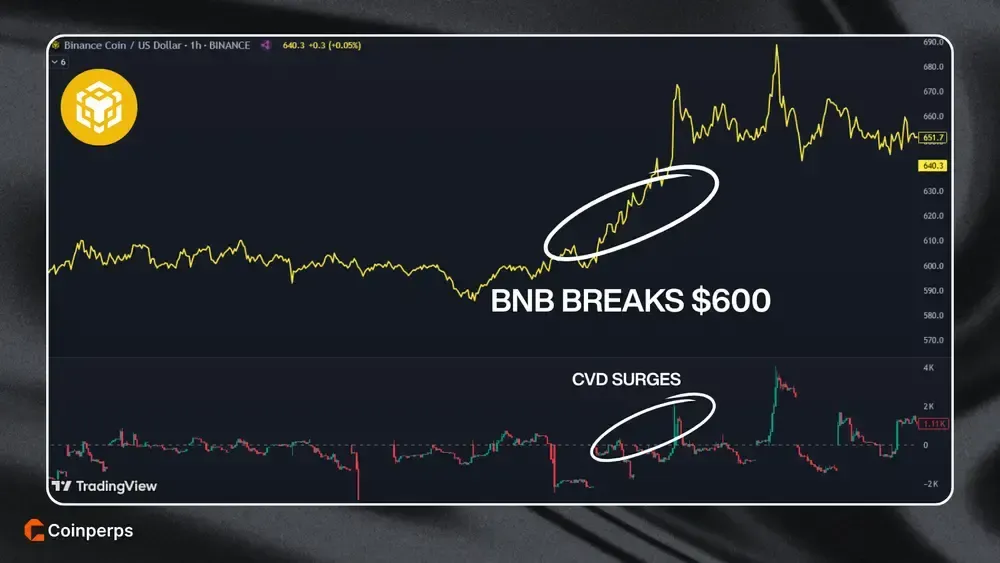
- Example breakout: BNB breaks $600 resistance and CVD surges at the breakout point. This confirms strong buy interest and justifies entering a long.
Timing Entries During Consolidation (Accumulation and Distribution)
Sideways markets are unclear on the surface, but CVD helps reveal what large players are doing behind the scenes.
- Accumulation: Flat price but rising CVD means buyers are stepping in gradually. This shows someone is absorbing supply without aggressively moving the price up yet.
- Distribution: Flat or slightly rising price with falling CVD signals quiet selling. It suggests sellers are offloading positions during minor rallies before a drop.
- Tactical approach: Use CVD behavior to time range trades. Buy near support during accumulation or short near resistance during distribution, using tight stops beyond the range.
- Example distribution: Bitcoin drifts between $100k and $102k while CVD keeps dropping. This indicates distribution and a downside break becomes more probable.
- Example accumulation: Ethereum ranges between $1800 and $1850 while CVD steadily climbs. This shows buy interest building and an upside breakout is more likely.

Limitations and Risks of Using CVD
CVD can give misleading signals during low-volume sessions or on illiquid trading pairs. In these conditions, small trades can cause sharp moves in the delta that don’t reflect meaningful intent.
The indicator only tracks aggressive market orders and ignores passive limit orders until they are filled. As a result, large hidden liquidity or iceberg orders may move price without leaving a clear trace on CVD.
Relying on CVD without considering chart structure or market context can lead to false conclusions. Use it as a supporting tool, not a decision-maker on its own.
Combining CVD with Other Tools and Indicators
CVD by itself offers valuable insights into order flow, but it becomes far more effective when combined with other tools. Think of CVD as the context layer that explains why something is happening, while other indicators help decide what and when to act.
- CVD + VWAP: Use VWAP as a bias anchor and let CVD show if aggressive participants are reinforcing or fighting that directional bias.
- CVD + Footprint Charts: Footprint charts reveal exact buy or sell imbalances per price bar, while CVD shows the net pressure over time.
- CVD + Time & Sales: Tape reading shows bursts of market activity, and CVD translates those into cumulative buying or selling intensity.
- CVD + Liquidity Zones: At major support or resistance levels, CVD signals whether buyers are absorbing supply or sellers are defending the level.
- CVD + RSI: A CVD divergence paired with an RSI divergence adds strength to a potential reversal setup.
- CVD + Moving Averages: When price bounces from a moving average, rising CVD confirms that dip buyers are stepping in aggressively.
- CVD + Open Interest: Together with open interest data, CVD reveals if new money is backing a move or if it’s just short-covering or long liquidation.
- CVD + Funding Rates: If funding sentiment is extreme but CVD shows the opposite pressure, it can signal an upcoming squeeze or unwind.
Bottom Line
CVD tracks who’s in control by measuring aggressive market orders, not just price movement. Use it to validate breakouts, spot divergences, and read intent around key levels like VWAP or liquidity zones.
When CVD supports the move, act with more confidence; when it doesn’t, reassess, reduce size, or wait for better confirmation. Over time, you’ll start to spot recurring CVD behaviors that help anticipate shifts before they show up in price.
Trade sharp, stay patient, and may the flow be with you.