Bitcoin Pi Cycle Top Indicator Explained
Discover how the Bitcoin Pi Cycle Top Indicator has predicted every major BTC peak since 2013 and what it could mean for Bitcoin in 2025.

Fact checked
Key Takeaways:
- The Pi Cycle Top Indicator is a Bitcoin market-timing model that calculates the relationship between the 111-day moving average and twice the 350-day moving average.
- Historical backtesting demonstrates it successfully signaled the 2013, 2017, and April 2021 cycle peaks within days, each followed by steep 50 to 80 percent multi-month declines.
- During 2025 the indicator has not yet produced a crossover, although analysts anticipate one in September that could precede a dramatic 180,000 to 200,000 dollar market top for BTC.
The Bitcoin Pi Cycle Top Indicator may sound like a quirky math reference, but it is one of the most accurate tools for spotting Bitcoin’s cycle peaks. While some market-timing models resemble code-breakers for Wall Street quants, this one hides its brilliance in plain sight.
It blends elegance, mathematics, and brutal market truths into a single, unforgettable signal for traders and analysts trying to time BTC cycles.
What Is the Pi Cycle Top Indicator?
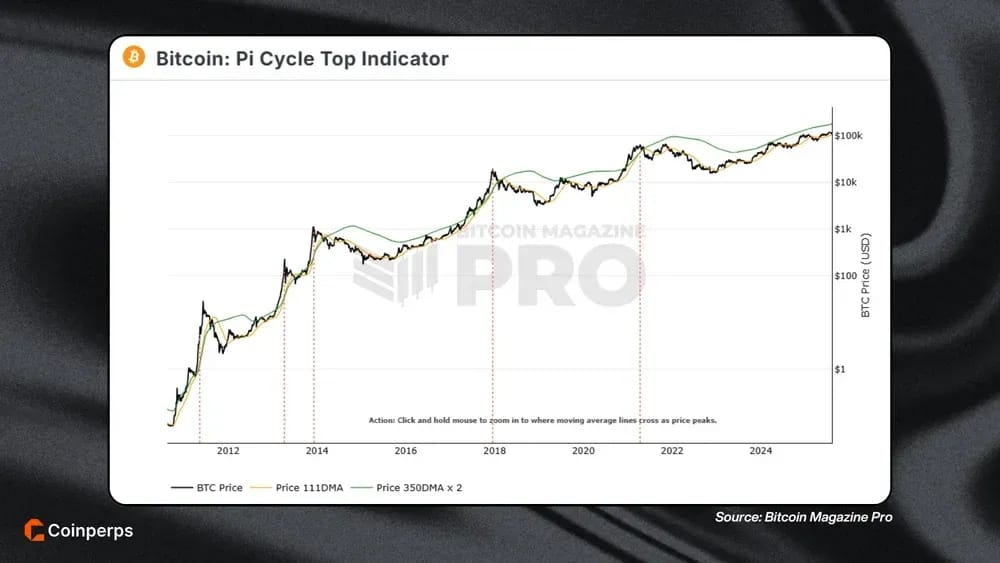
The Bitcoin Pi Cycle Top Indicator is a technical analysis tool that signals when Bitcoin’s price may be nearing a historically significant cycle peak. Created by Philip Swift in 2019, it uses two specific moving averages to identify extreme overextension in market momentum and potential market tops.
Backtesting shows it would have flagged several major Bitcoin peaks within days of the actual highs, helping traders sidestep prolonged drawdowns. The ratio of its key moving averages, 350 and 111, is about 3.153, which is notably close to π.
When we first examined the Pi Cycle Top Indicator, it seemed deceptively simple, yet every chart revealed new insights. Through repeated testing, we saw why it continues to attract Bitcoin traders aiming to time cycle peaks with mathematical precision.
How the Pi Cycle Top Indicator Works
The Pi Cycle Top Indicator signals a market top when Bitcoin’s 111-day moving average closes above twice the 350-day moving average.
This rare crossover, seen only during parabolic bull market phases, has historically appeared in periods of extreme upward momentum, making it a valuable tool for timing late-stage crypto rallies.
From our experience analyzing it closely, here’s the mechanical process behind the Pi Cycle Top:
- Identify the averages: The 111-day MA reflects medium-term shifts, while the doubled 350-day MA creates a heightened benchmark aligned with broader yearly performance.
- Watch the narrowing: Normally, the fast line stays comfortably below the slow line until unusual upward momentum compresses the gap rapidly.
- Confirm the cross: The signal is triggered the day the 111-day closes above the doubled 350-day, indicating unsustainable market acceleration.
- Anticipate the fallout: Historically, such crossovers have been followed by steep corrections, often exceeding 50% within subsequent months.
How to Set Up the Bitcoin Pi Cycle Top Indicator
The Bitcoin Magazine Pro Pi Cycle chart (from the original creator, Philip Swift of LookIntoBitcoin) and Bitbo both let you access the Pi Cycle instantly, without complex setup.
Here’s how to use each for accurate, interactive analysis:
- Open Bitcoin Magazine Pro’s Pi Cycle chart: Visit the Pi Cycle Top page and the BTC/USD daily chart will load instantly with 111-day and 350-day x 2 moving averages pre-configured.
- Zoom in with drag or pinch: Click-and-drag on desktop, or pinch on mobile, to focus on a specific cycle or shorter time window.
- Zoom out with a double click: Double-click anywhere on the chart to reset the view and instantly see the full historical dataset in one frame.
- Hover for exact crossover data: Move your cursor over the moving averages to view exact dates, price levels, and the relationship between the two lines at each point.
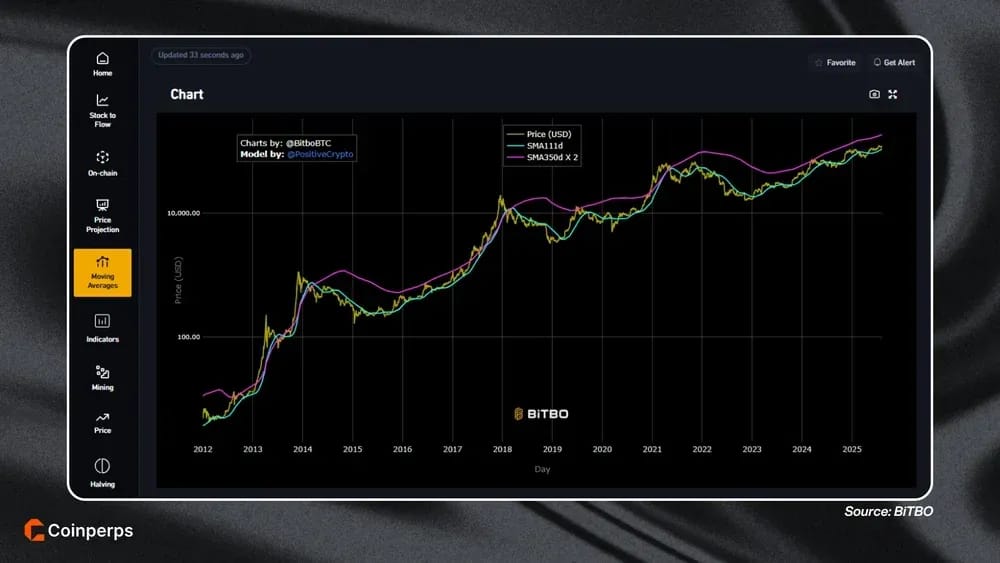
- Switch to Bitbo for comparison: Bitbo’s Pi Cycle chart also loads instantly, using the same MA periods, but offers a more compact visual for quick cycle-to-cycle comparison.
- Use Bitbo zoom and scroll controls: Just like Bitcoin Magazine Pro, you can click-and-drag or pinch to zoom, then double-click to zoom back out.
- Cross-check cycles on both sites: Review each crossover date and its proximity to historical tops on both charts to confirm alignment before acting on a signal.
Historical Performance and Examples
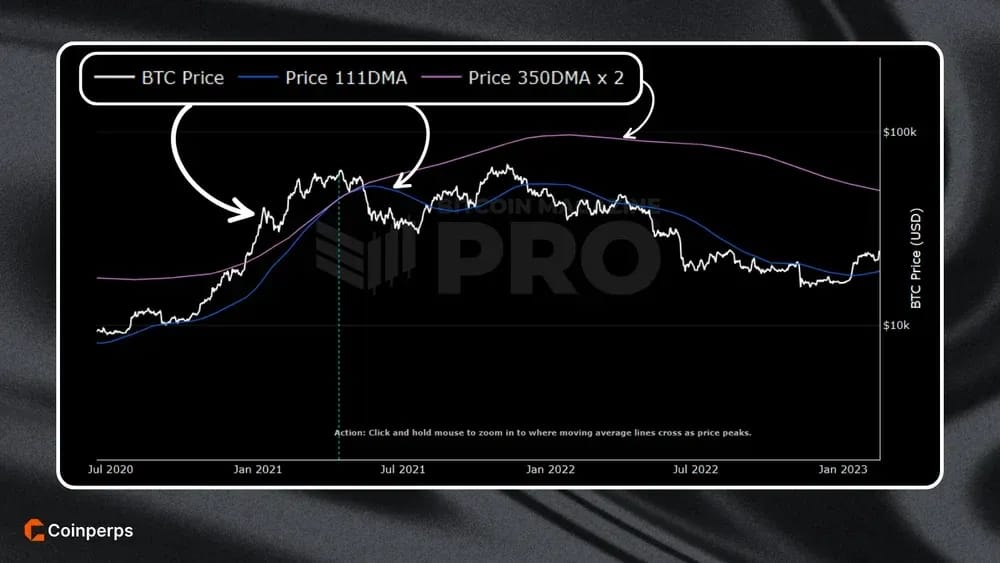
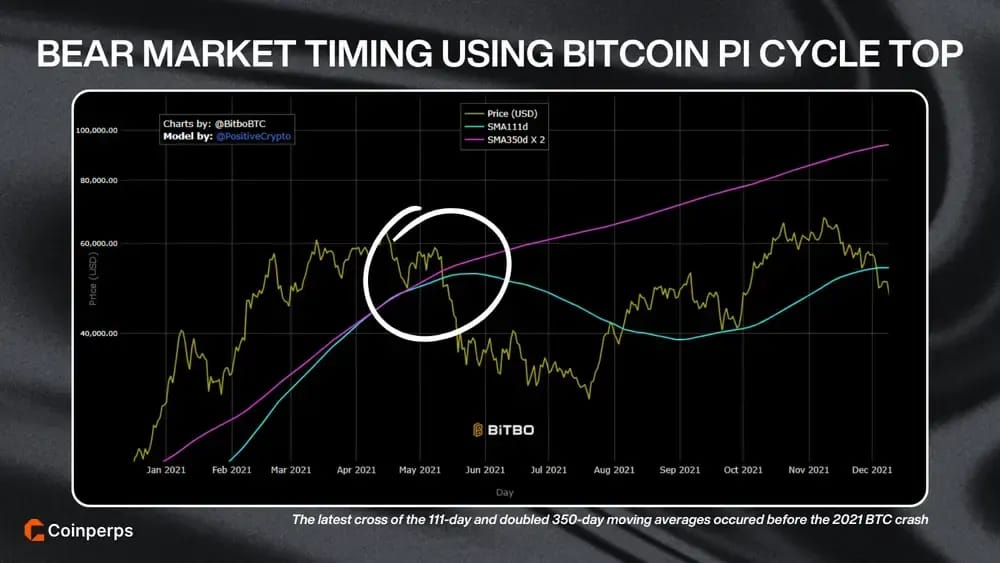
The Pi Cycle Top Indicator’s reputation is built on its ability to mark historical Bitcoin peaks with remarkable precision. Backtesting shows it identified tops in April 2013, December 2013, December 2017, and April 2021 within days of each high.
Its sole miss came during Bitcoin’s November 2021 double-top, when no crossover occurred despite a slightly higher all-time high. This was due to the moving averages not converging as they had earlier in April 2021.
These signals historically coincided with subsequent market crashes of 50-80%, offering traders opportunities to protect gains and sidestep brutal downturns. Even when slightly early or late, the alerts aligned closely enough with peaks to provide a serious tactical advantage.
Bitcoin Pi Cycle Top Indicator Prediction For 2025
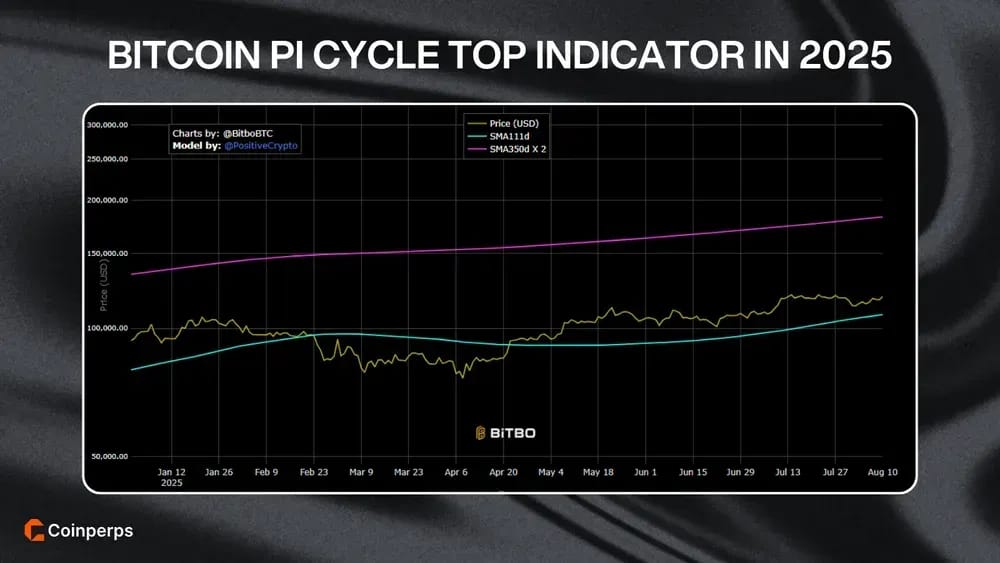
As of mid-2025, the Pi Cycle Top Indicator has not triggered, meaning Bitcoin’s 111-day average remains below twice the 350-day average. Bitcoin price peak prediction based on this tool suggests the bull run may have room to grow, indicating a huge upside before new all-time highs.
Analysts project a potential crossover around September 17, 2025, which could signal the start of a topping phase for Bitcoin. Price forecasts for late 2025 range between $180,000 and $200,000, impacted by institutional inflows, reduced supply, and ETF-related demand.
Why the Bitcoin Pi Cycle Top Indicator Works
The Pi Cycle Top Indicator’s accuracy may come from how it detects extreme deviations between shorter-term and longer-term market growth. These deviations often align with peak market sentiment, where investor psychology plays as large a role as underlying fundamentals.
Below are the main theoretical and behavioral factors that may explain why this simple moving average crossover has been so historically effective.
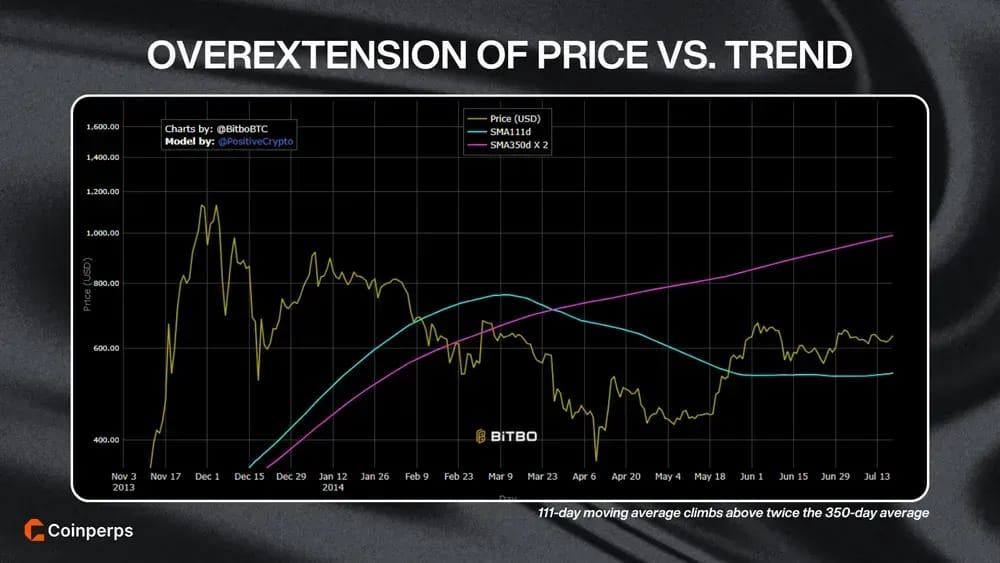
Overextension of Price vs. Trend
The Pi Cycle measures price overextension by comparing medium-term momentum against long-term averages. This imbalance reflects overheated market momentum and often emerges during the exciting final stages of a parabolic Bitcoin rally.
When the 111-day moving average climbs above twice the 350-day average, it quantitatively signals unsustainable momentum. Historically, this has marked major cycle tops that were closely followed by sharp corrections exceeding fifty percent.
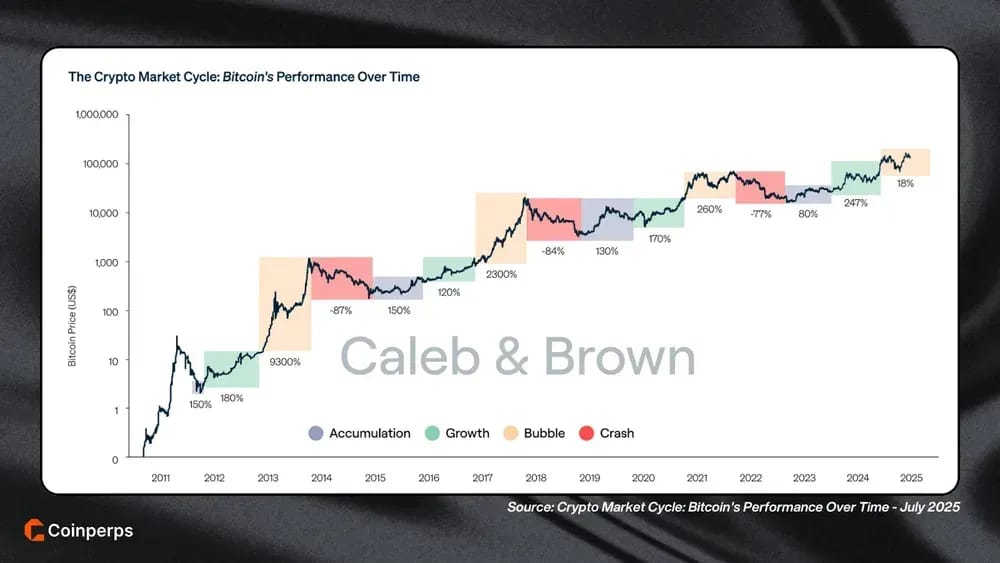
Bull Cycle Timing
The moving averages align closely with Bitcoin’s four-year halving cycle effect, which typically precedes the final surge of a bull market. The chosen 111-day and 350-day moving average lengths mirror the rhythm of these cycles, possibly by mathematical coincidence.
This timing means the crossover tends to occur during peak speculative excess. Traders using it can anticipate transitions from late-stage bull runs into the early phases of market contraction.
Behavioral Economics
The signal often aligns with market euphoria, when optimism drives traders to assume prices will rise indefinitely. During these periods, experienced traders often sell into strength, transferring assets from “strong hands” to less experienced participants.
Such a redistribution of holdings creates an imbalance in supply and demand. Once buying momentum fades, selling pressure intensifies, accelerating the reversal already hinted at by the Pi Cycle signal.
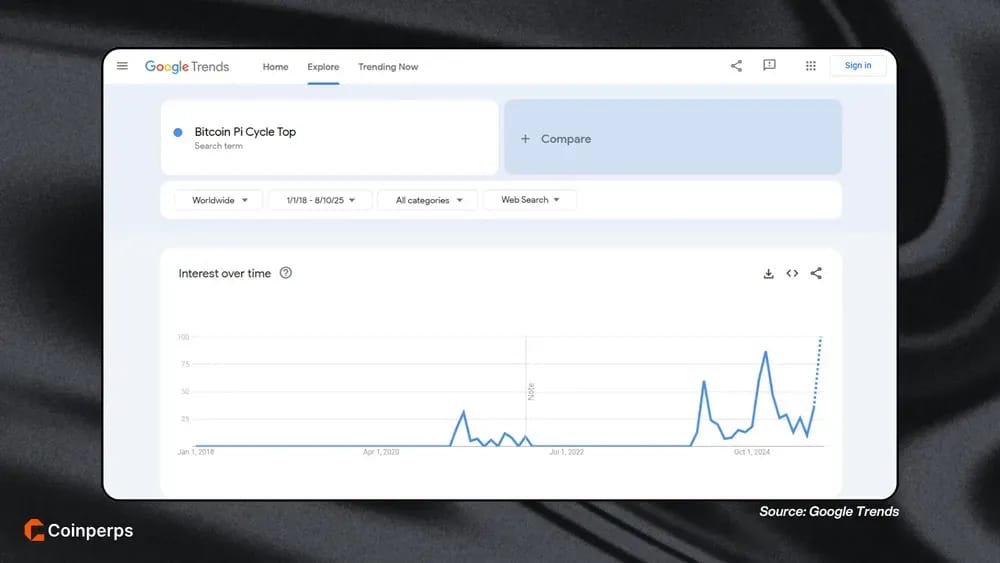
Self-Fulfilling Prophecy
Since 2019, the Pi Cycle has become quite popular (per Google Trends data), meaning traders worldwide anticipate its signals and often act on them. This collective behavior may amplify tops by triggering waves of profit-taking when the crossover occurs, reinforcing the signal’s historical success rate.
Although difficult to measure precisely, market reflexivity suggests that the very existence of a widely followed signal can help decide market outcomes. The Pi Cycle may now partly work because traders believe it works.
Limitations of the Pi Cycle Indicator
Despite its record, the Pi Cycle Top is constrained by limited historical data, the absence of bottom signals, and vulnerability to atypical cycle structures. Its performance relies on repeating patterns in Bitcoin’s market that may evolve with increased institutional participation or regulatory changes.
The Pi Cycle Top is often used alongside some of the best Bitcoin top indicators, such as the Puell Multiple, MVRV Z-Score, Bollinger Bands, and overbought RSI levels to confirm market reversals. This multi-layered confirmation approach helps filter out anomalies and prevent overreliance on a single crossover event.
Bottom Line
Across past cycles, Pi Cycle Top flashes preceded Bitcoin declines of 50-80%, offering unusually early warnings for profit preservation. The absence of a November 2021 signal shows it can miss complex structures, requiring confirmation from other high-confidence indicators.
In 2025, a projected crossover could arrive within months, and disciplined traders may reduce exposure before volatility accelerates against overheated sentiment. Those ignoring rare Pi Cycle warnings risk holding through steep drawdowns, forfeiting gains earned during Bitcoin’s most aggressive parabolic advances.
Frequently asked questions