Crypto Exchange Volume Statistics for 2026
See how much crypto actually trades, with quarterly volume, derivatives versus spot, the perp DEX boom, and where market flow concentrated this cycle.

Not financial advice.
Key takeaways
- The market is in a measured cooldown. Quarterly volume is 42% below its late-2025 peak but remains many times larger than in previous cycles.
- Derivatives dominate the tape, trading several times more volume than spot, with most activity concentrated on a small group of centralized platforms led by Binance.
- The structural shift is happening onchain. Perpetual DEXs reached a record 24% share against centralized futures, while equity perps developed into a meaningful category.
On this page 9 sections
Crypto trading volume tells two stories in 2026. Headline activity has fallen sharply from the record quarter at the end of 2025. Beneath that decline, the mix of spot and derivatives, centralized and onchain trading, and crypto and equity-linked products continues to change much faster than the aggregate totals imply.
This page brings together the main volume statistics behind those shifts, using data from TokenInsight, CCData, The Block, DefiLlama, and exchange disclosures.
For live figures across platforms, visit our perpetual exchanges portal.
Top 8 Crypto Exchange Volume Statistics (2026)
The eight statistics below cover total market activity, the spot-versus-derivatives split and platform concentration. They also show how onchain market share, new asset classes, and the options landscape are changing.
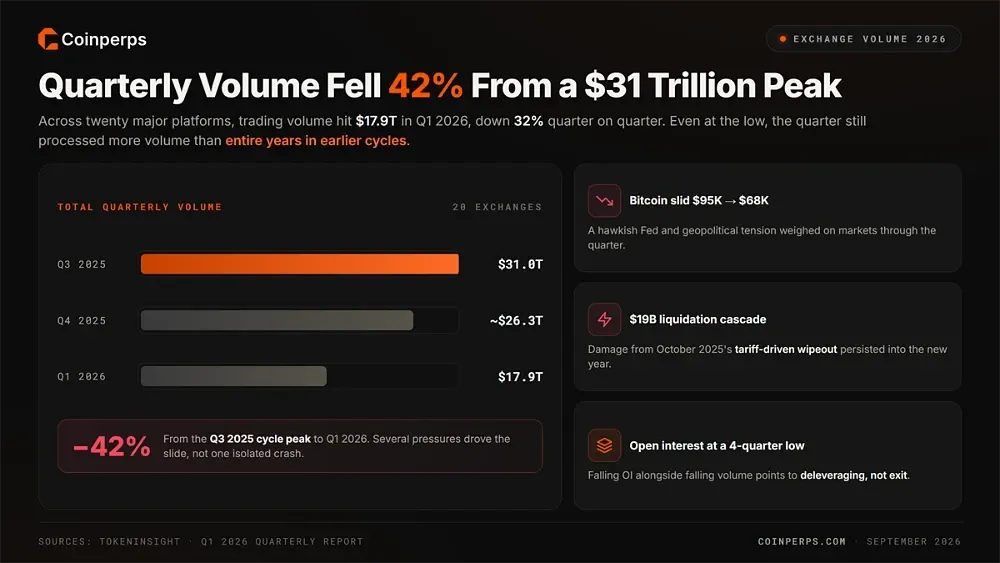
1. Quarterly Volume Fell 42% From a $31 Trillion Peak
Across twenty major platforms, total exchange trading volume reached $17.9 trillion in the first quarter of 2026, according to TokenInsight. That was down 32% quarter on quarter and 42% below the $31.0 trillion cycle peak recorded in the third quarter of 2025.
Several identifiable pressures drove the decline rather than one isolated crash. A hawkish Federal Reserve and geopolitical tension weighed on markets, while the damage from October 2025's tariff-driven $19 billion liquidation cascade persisted. Bitcoin moved from roughly $95,000 toward $68,000 during the quarter.
The scale of the decline needs context. Even at the lower level, the quarter processed more trading volume than entire years in earlier cycles. Average open interest also fell to a four-quarter low, pointing to deleveraging rather than exit, a distinction visible on our open interest dashboard.
2. Derivatives Out-Trade Spot Roughly Five to One
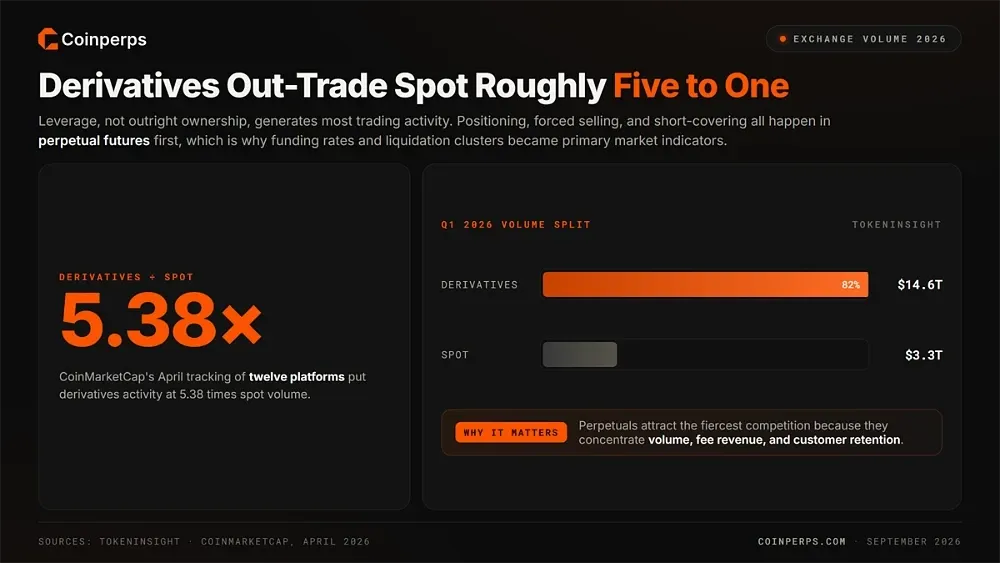
Leverage accounts for far more trading activity than outright ownership, and the first-quarter split makes the imbalance clear.
The key volume figures were:
- Derivatives: TokenInsight recorded $14.6 trillion in first-quarter derivatives volume.
- Spot: The same report measured $3.3 trillion in spot trading volume.
- Market-wide multiple: CoinMarketCap's April tracking of twelve platforms put derivatives activity at 5.38 times spot volume.
That imbalance has a direct effect on price formation. Much of the market's positioning happens in perpetual futures, along with forced selling and short-covering. As a result, funding rates and liquidation clusters have moved from specialist metrics to primary market indicators.
It also helps explain exchange strategy. Perpetuals attract the fiercest competition because they concentrate volume, fee revenue, and customer retention. Our perps versus spot guide explains what that structural difference means for an individual trader.
3. Binance Holds a Third of Volume as the Top Five Take 72%
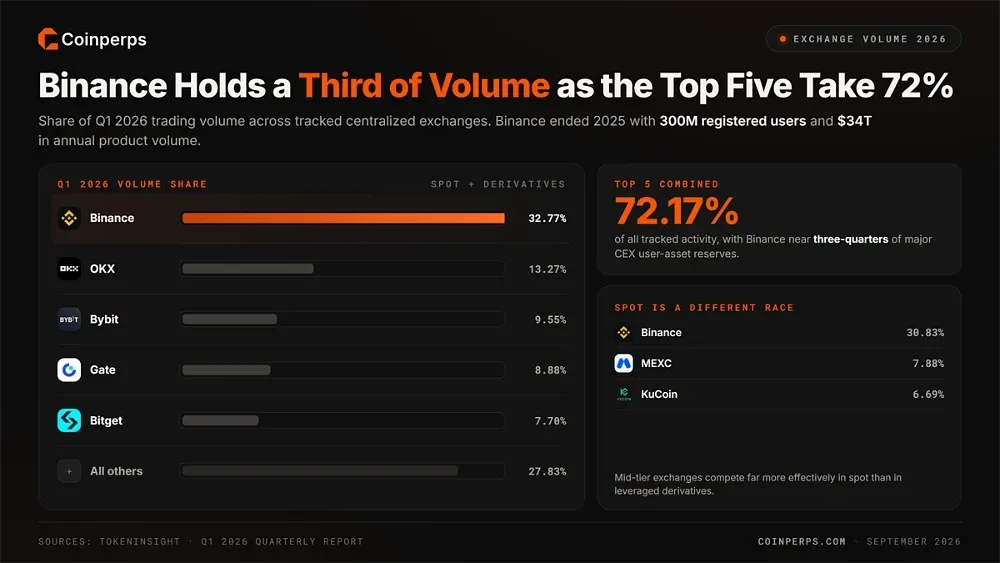
Exchange activity remains heavily concentrated. Binance alone accounted for almost one-third of first-quarter trading volume, while the five largest centralized platforms controlled 72.17% of all tracked activity.
First-quarter market share broke down as follows:
Other measures show an equally concentrated market. Binance ended 2025 with 300 million registered users and $34 trillion in annual product volume, according to its co-founders' year-end statement. Quarterly market-share research also placed its share of major CEX user-asset reserves near three-quarters of the total.
Spot produces a noticeably different ranking. Binance still led at 30.83%, but MEXC held 7.88% and KuCoin 6.69%. Mid-tier exchanges therefore compete much more effectively in spot than in the leveraged derivatives activity dominating overall volume.
4. DEX Futures Hit a Record 24% of Centralized Volume
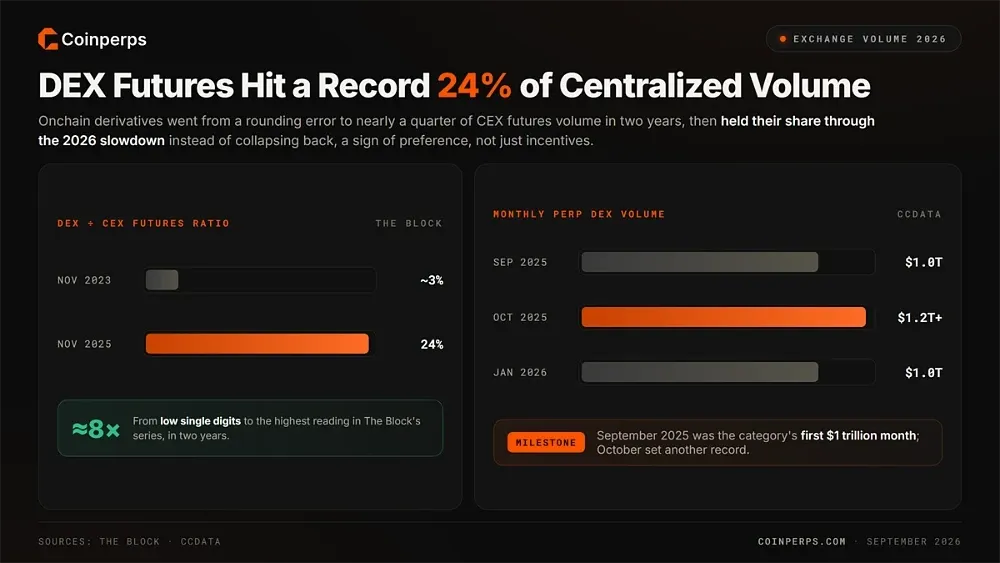
Decentralized futures volume climbed to roughly 24% of centralized futures volume in November 2025, the highest reading in The Block's series. Only two years earlier, the ratio had been in the low single digits as far less derivatives activity took place onchain.
Absolute volume expanded alongside market share. Perpetual DEXs exceeded $1 trillion in monthly volume for the first time in September 2025, then set another record above $1.2 trillion the following month. CCData subsequently measured the category maintaining a $1.00 trillion monthly pace into January.
More notable is what happened during the subsequent slowdown. Onchain activity fell with centralized volume through early 2026 instead of collapsing toward its previous base. That suggests the migration reflects trader preference rather than only a temporary incentive cycle, with current activity tracked on our perp DEX aggregator.
5. Hyperliquid Broke Into the Overall Top-10 Derivatives Table
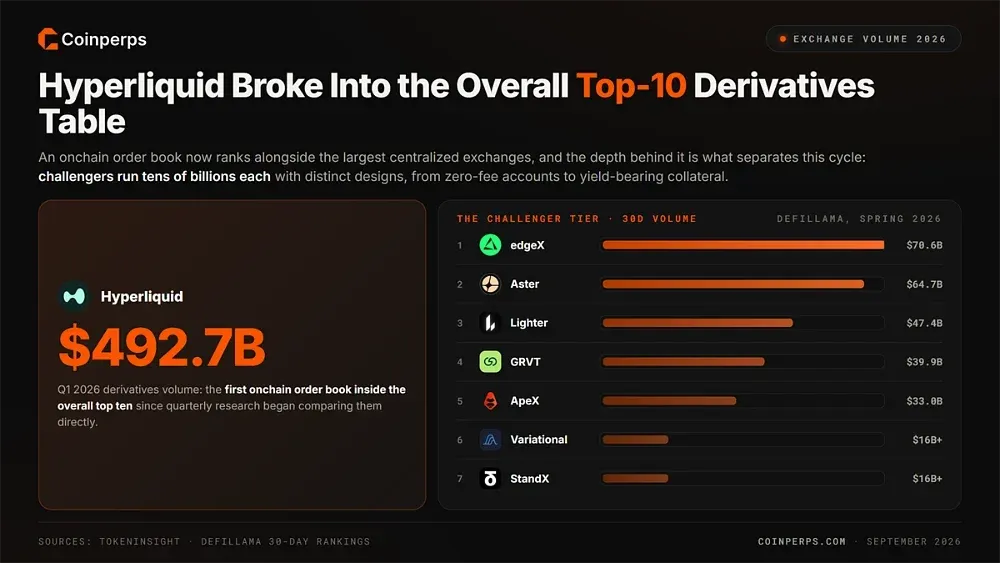
Hyperliquid generated roughly $492.7 billion in first-quarter derivatives volume, putting an onchain order book inside the overall top ten alongside the largest centralized exchanges for the first time since quarterly market-share research began comparing them directly.
The more important structural change is the amount of activity now sitting behind the category leader.
DefiLlama's spring 30-day rankings showed:
- edgeX: Near $70.6 billion in volume.
- Aster: $64.7 billion.
- Lighter: $47.4 billion.
- GRVT: $39.9 billion.
- ApeX: $33.0 billion.
- Variational and StandX: More than $16 billion each.
That depth separates the current cycle from earlier ones. Onchain derivatives volume no longer depends on one protocol succeeding. Challengers are competing through distinct designs, ranging from zero-fee retail accounts to yield-bearing collateral, rather than simply reproducing the category leader's model.
6. Equity and RWA Perpetuals Grew 162% Into a Real Category
Perpetual markets are also expanding beyond crypto-native assets. Contracts linked to stocks, indices, and commodities moved from a relatively small segment into a meaningful source of exchange activity entering 2026.
The category's growth shows up in several figures:
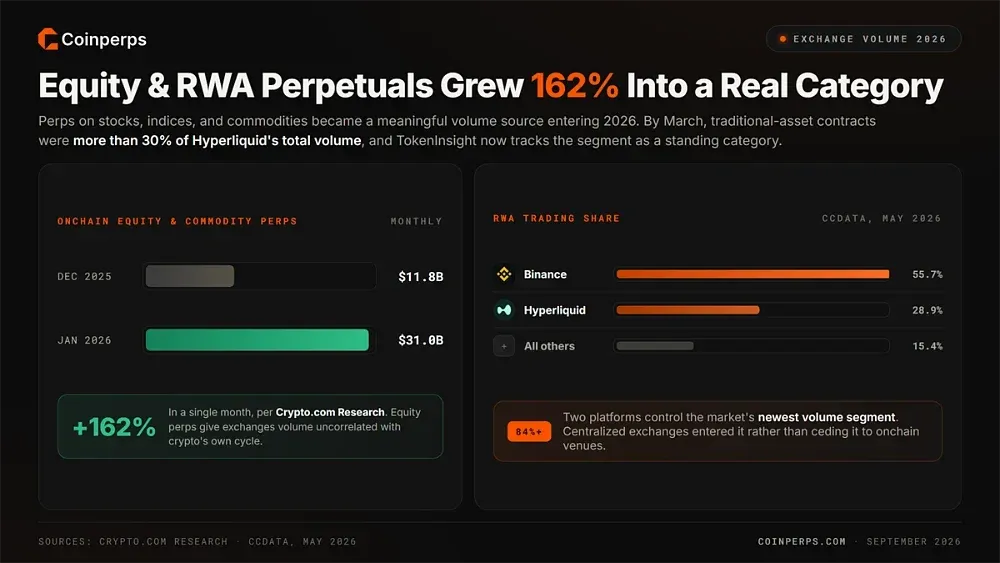
- Onchain volume: Crypto.com Research recorded a 162% increase, from $11.8 billion in December 2025 to $31.0 billion the following month.
- Hyperliquid mix: Traditional-asset contracts represented more than 30% of Hyperliquid's total volume by March.
- Binance RWA share: CCData's May review put Binance at 55.7% of RWA trading.
- Hyperliquid RWA share: Hyperliquid held another 28.9%.
- Combined concentration: The two platforms accounted for more than 84% of activity in the market's newest volume segment.
Centralized exchanges therefore entered the segment rather than leaving it to onchain venues. The importance also extends beyond the headline totals. Equity perpetuals give exchanges a volume stream uncorrelated with crypto's own boom-and-bust cycle.
TokenInsight now tracks the segment as a standing reporting category, a status it did not hold even one year earlier.
7. Regulated Options Overtook the Crypto-Native Leader
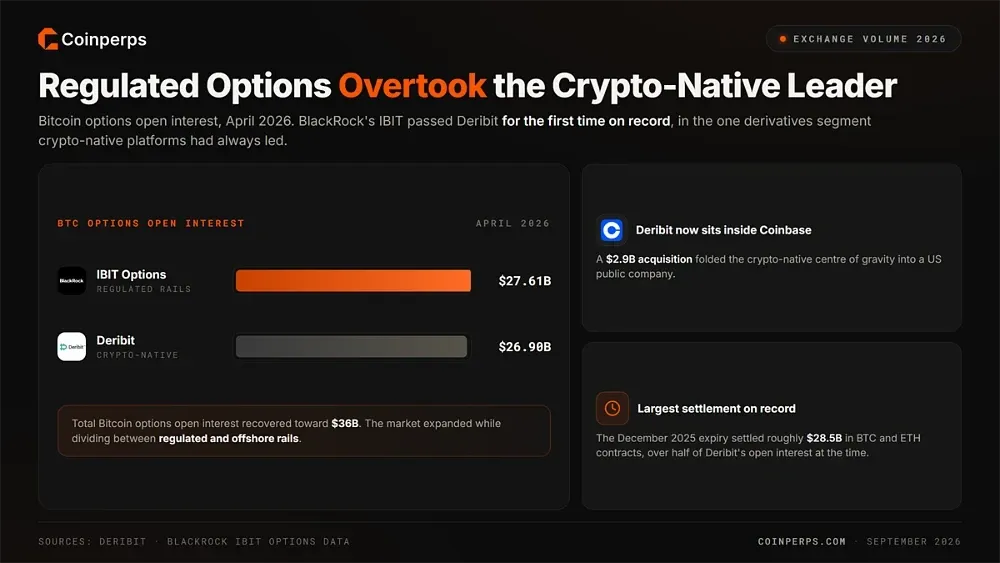
Bitcoin options open interest on BlackRock's IBIT reached $27.61 billion in April, overtaking Deribit's $26.9 billion for the first time on record. It marked a change in the one derivatives segment where crypto-native platforms had historically maintained a comfortable lead.
Deribit nevertheless remains the crypto-native centre of gravity and now sits inside Coinbase following its $2.9 billion acquisition. The December 2025 expiry settled roughly $28.5 billion in Bitcoin and Ethereum contracts. That represented more than half of Deribit's open interest at the time and was the largest single settlement the market has processed.
Total Bitcoin options open interest recovering toward $36 billion puts both figures in context. The market expanded while dividing between regulated and offshore rails. Our crypto options platforms guide covers that split in more detail from the trader's perspective.
8. Monthly CEX Volume Sits at Its Lowest Since 2024
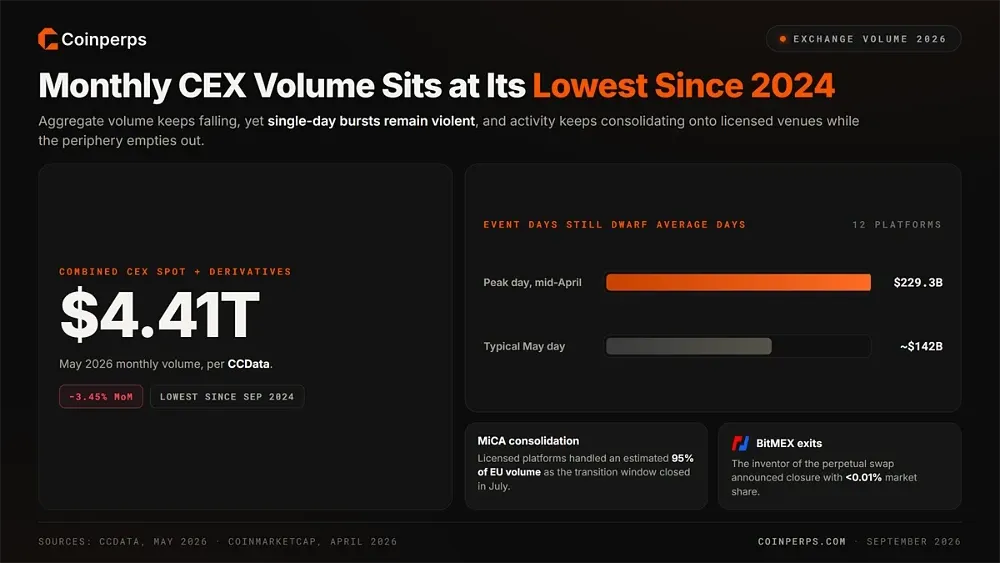
Combined spot and derivatives volume across centralized exchanges dropped to $4.41 trillion in May. CCData measured a 3.45% month-on-month decline, taking the series to its lowest point since September 2024 and extending the drawdown that followed the record-setting autumn quarter.
The quieter monthly picture still contains sharp bursts of activity. CoinMarketCap's April data showed a single-day peak near $229.29 billion across twelve tracked platforms in the middle of the month. Event-driven spikes therefore remain powerful even as aggregate monthly volume continues to fall.
Consolidation is occurring at the same time. Licensed platforms already handled an estimated 95% of EU volume when MiCA's transition window closed in July. BitMEX, the exchange that invented the perpetual swap, announced its closure with less than 0.01% market share, showing how strongly activity continues to leave the periphery.
How Crypto Exchange Volume Is Measured
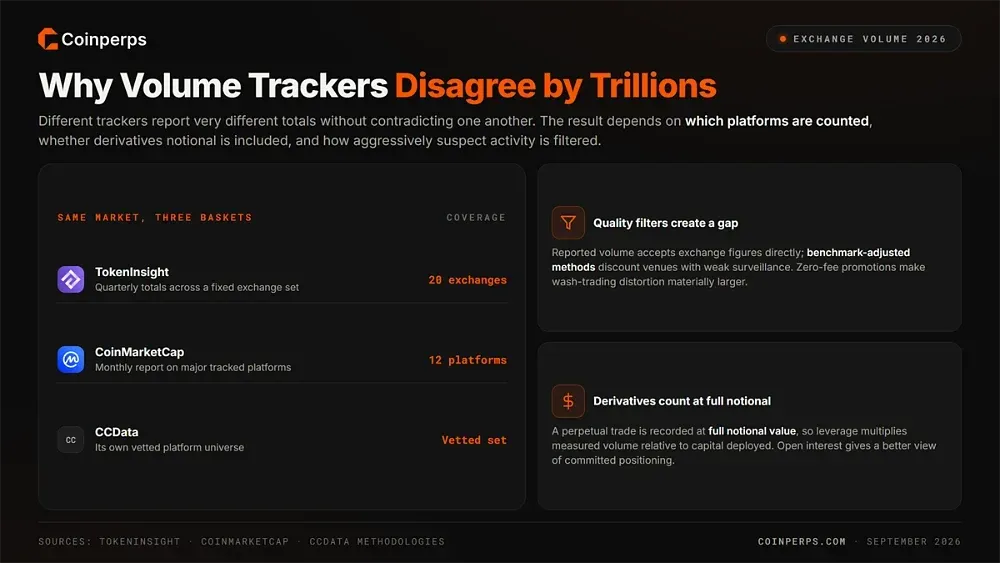
Different trackers can report very different exchange-volume figures without necessarily contradicting one another. The result depends on which platforms are included, whether derivatives notional is counted, and how aggressively suspect activity is filtered. Those choices can shift quarterly estimates by trillions of dollars.
Coverage creates the largest immediate difference. TokenInsight's quarterly total includes twenty exchanges, while CoinMarketCap's monthly report follows twelve. CCData uses its own vetted platform universe. Because the underlying baskets differ, the same month can produce different totals across all three providers.
Quality filters create another gap. Reported volume generally accepts exchange figures directly, whereas benchmark-adjusted methods discount venues with weaker market surveillance. Wash trading and incentive-driven churn can inflate raw activity, with zero-fee promotions making the distortion materially larger.
Derivatives introduce a separate accounting issue. A perpetual trade is recorded at its full notional value, allowing leverage to multiply measured volume relative to the capital deployed. That is one reason derivatives dominate aggregate totals, while open interest gives a better view of committed positioning.
Stablecoins as Trading Infrastructure
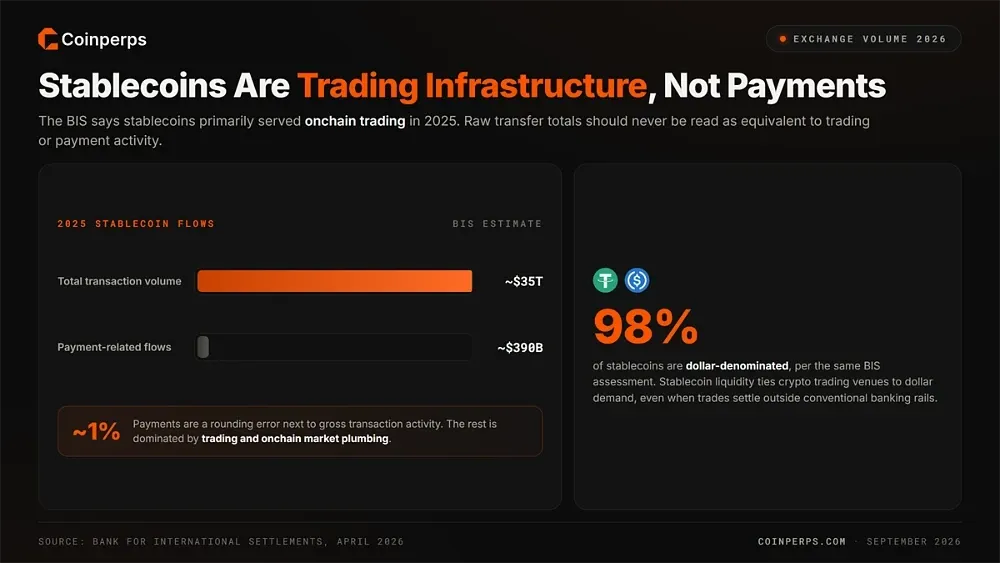
Stablecoins sit beneath a large share of crypto trading activity even when they do not appear in headline exchange-volume totals. The Bank for International Settlements says stablecoins primarily served onchain trading in 2025, while payment-related use remained much smaller than gross transaction activity.
That distinction matters when comparing exchange volume with blockchain transfer data. The BIS estimated stablecoin transaction volume at about $35 trillion during 2025, yet payment-related flows were roughly $390 billion, showing why raw transfer totals should not be treated as equivalent to trading or payments.
Dollar exposure also remains central to the structure. About 98% of stablecoins are denominated in dollars, according to the same BIS assessment, so stablecoin liquidity links crypto trading venues to dollar demand even when the underlying trades settle outside conventional banking rails.
CEX vs DEX Volume Compared
Centralized and onchain markets are moving closer together in function, but their scale remains very different. The table compares both sides using the same recurring measures tracked throughout this page, based on figures from the sources already cited above.
Measure | Centralized exchanges | Perpetual DEXs |
|---|---|---|
Monthly Volume | $4.41T (May, CCData) | ~$1.00T futures (January, CCData) |
Share Benchmark | ~76% of futures flow | Record 24% of CEX futures |
Leader | Binance, ~33% of total volume | Hyperliquid, top-10 overall entrant |
Open Interest | $23.9B daily average on Binance alone | ~$11B across the whole category |
Newest Segment | RWA led by Binance at 55.7% | 30%+ of Hyperliquid volume is TradFi assets |
On scale, the incumbents still lead decisively. Binance's average daily open interest alone is greater than the entire perpetual DEX category's combined total. Centralized order books can also absorb institutional-size trades that most onchain markets cannot yet match across trading pairs.
Momentum points in the other direction. The onchain share of futures volume roughly tripled within two years, while the challenger group behind Hyperliquid continued to broaden. Equity perpetuals also appeared onchain before centralized exchanges moved into the category.
How Traders Use Volume Data
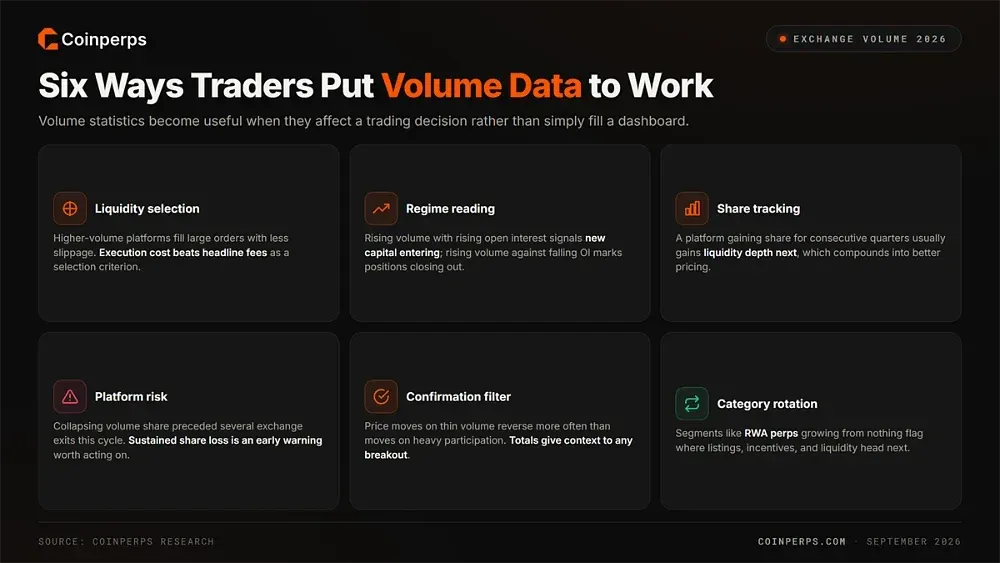
Volume statistics become useful when they affect a trading decision rather than simply fill a dashboard. The most practical applications are:
- Liquidity selection: Higher-volume platforms fill large orders with less slippage, which is why execution cost usually beats headline fees as a selection criterion.
- Execution benchmarking: VWAP weights average price by traded volume, giving traders a reference point for judging whether their fills were relatively efficient.
- Regime reading: Rising totals alongside rising open interest signal new capital entering, while rising volume against falling open interest marks positions closing out.
- Share tracking: A platform gaining volume share for consecutive quarters usually gains liquidity depth next, which compounds into better pricing for its traders.
- Platform risk: Collapsing volume share preceded the exits of several platforms this cycle, making sustained share loss an early warning worth acting on.
- Confirmation filter: Price moves on thin volume reverse more often than moves on heavy participation, so totals provide context for any breakout or breakdown.
- Category rotation: Watching segments like RWA perps or onchain options grow from nothing flags where listings, incentives, and liquidity head next.
What Exchange Volume Cannot Tell You Alone
Trading volume is useful, but it cannot describe execution quality by itself. Kaiko recommends reading it alongside order-book depth and slippage when assessing liquidity.
The gaps become clearer when these measures are separated:
- Market depth: High turnover can coexist with thin order books, leaving large trades exposed to price impact despite impressive headline volume.
- Slippage: Volume shows what traded historically, while slippage estimates how far a market order may move from the quoted price during execution.
- Bid-ask spread: A busy market can still be expensive to cross when spreads widen, especially during volatility or on less-liquid trading pairs.
- Order size: The same venue may handle small trades efficiently but struggle with institutional-size orders, so volume alone cannot predict execution capacity.
- Fee effects: Zero-fee promotions can inflate trading activity without producing a matching increase in market depth, making raw volume look unusually strong.
- Wash trading: Reported activity may include artificial turnover, which is why Coin Metrics maintains a separate trusted-volume framework for selected exchanges.
- Pair concentration: Exchange-wide totals can hide weak liquidity in individual markets because activity often concentrates heavily in a smaller set of pairs.
- Time sensitivity: Monthly volume averages can conceal sharp intraday changes in depth and slippage, so execution conditions still need real-time market data.

Bottom Line
Crypto exchange volume in 2026 remains below its peak, but the market is structurally healthier than in earlier cycles. Activity has consolidated on licensed platforms and credible protocols, leverage has reset from the October extreme, and the main growth areas now sit onchain and in contracts linked to traditional assets.
From here, market share matters more than the headline total. The DEX-to-CEX ratio, RWA volume mix, and challenger tier forming behind Hyperliquid will reveal more about the next cycle's structure than whether monthly trading volume returns to its record.
Methodology
This page combines quarterly research, monthly exchange reviews, and dashboard data, using recurring measures to make trading-volume comparisons as consistent as possible.
- TokenInsight: Used for quarterly totals, market share, and the spot versus derivatives split across twenty exchanges.
- CCData: Used for monthly centralized exchange volume, DEX futures volume, and RWA category share.
- The Block: Used for the DEX-to-CEX futures ratio and monthly perpetual DEX records.
- DefiLlama: Used for protocol-level 30-day volume rankings across perpetual DEXs.
- CoinMarketCap: Used for tracked-exchange totals, the derivatives multiple, and peak-day figures.
- Exchange disclosures: Used for user counts, annual volume, and reserve figures where platforms publish them.
FAQs
Which crypto exchange has the highest trading volume?
Binance leads every major measure, accounting for roughly one-third of total volume in the first quarter of 2026 and reporting 300 million registered users. OKX, Bybit, Gate, and Bitget round out a top five responsible for about 72% of all tracked exchange activity.
How much crypto trading volume is there per day?
Daily averages sit in the low hundreds of billions of dollars when spot and derivatives are combined. Across twelve tracked platforms, the busiest single day in April reached about $229 billion. Event-driven sessions can produce roughly twice the volume of quieter days.
What share of trading happens on decentralized exchanges?
Decentralized futures reached a record 24% of centralized futures volume in November 2025 and maintained a monthly pace near $1 trillion into January. Incentives can push the share higher or lower over shorter periods, but the direction across two years remains firmly upward.
Why do volume numbers differ between data providers?
Trackers do not all measure the same universe. Each includes a different exchange set and applies its own quality filters. Reported figures accept exchange data directly, adjusted methodologies discount venues with weak surveillance, and derivatives notional expands totals wherever leverage is high. Quarterly differences of trillions are therefore normal.


