Polymarket Perpetuals Statistics and What $18 Billion in Volume Shows
Polymarket Perps has matched $18.38 billion since May and holds about $111 million of open interest. See the latest data on volume, markets, fees, rewards, funding, traders and risk.

Not financial advice.
Key takeaways
- Volume peaked in the beta: Polymarket Perps has matched $18.38 billion since 6 May 2026, but monthly volume fell from $4.03 billion in June to $1.86 billion in October.
- Open interest keeps rising: Open interest climbed every month to a record $112.4 million on 4 November, led by the S&P 500 and Nasdaq 100 contracts.
- Incentives outweigh fees: The venue pays $75,000 a day in liquidity rewards against about $19,300 a day of trading fees, which keeps its main order books deep.
- A few accounts dominate: The top 100 accounts produce 96.6% of the notional traded by the 1,000 most active, and two in three of those 1,000 are losing money.
On this page 9 sections
- Polymarket Perpetuals Statistics at a Glance
- Polymarket Perps Trading Volume and Trades
- Polymarket Perps Open Interest and Positioning
- Which Markets Trade Most on Polymarket Perps
- Polymarket Perps Fees, Rewards and Revenue
- Liquidity, Leverage and Funding on Polymarket Perps
- Polymarket Perps Traders and Leaderboard Concentration
- How Polymarket Perps Compares and Where the Risks Sit
- The Bottom Line
Polymarket Perps is the perpetual futures exchange the largest prediction market runs outside the United States and Canada. It has matched $18.38 billion across 90 markets since 6 May 2026, and open interest has risen every month to about $111 million while volume cooled.
The product was announced on 21 April, ran as an invite-only beta through the summer and opened to the public on 3 September. Unlinked figures come from our pull of Polymarket's public Perps API at about 09:30 UTC on 6 November, with daily data to 5 November.
Which countries can trade is a separate question, answered in our Polymarket restricted countries list. The wider market sits in our crypto perpetual futures statistics and perp DEX statistics.
Polymarket Perpetuals Statistics at a Glance
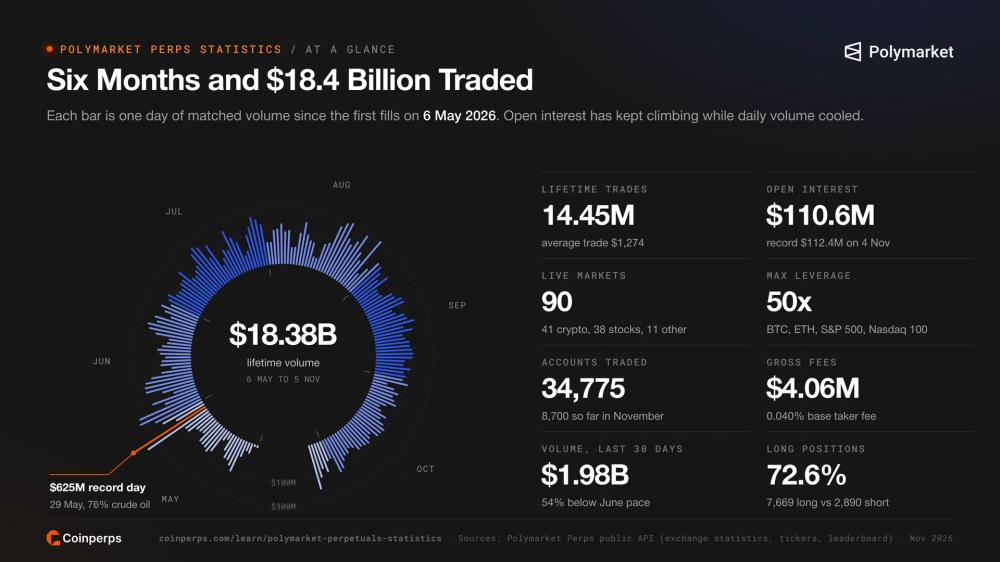
Here is where Polymarket Perps stood on 5 November. Rows marked Coinperps data come from the public API.
Metric | Value | Source |
|---|---|---|
First trades | 6 May 2026 (S&P 500 and gold) | Coinperps data |
Public launch | 3 September 2026 | |
Lifetime volume | $18.38 billion | Coinperps data |
Lifetime trades | 14.45 million | Coinperps data |
Record month | $4.03 billion, June 2026 | Coinperps data |
Record day | $625 million, 29 May 2026 | Coinperps data |
Volume, last 30 days | $1.98 billion | Coinperps data |
Open interest | $110.6 million (record $112.4 million on 4 November) | Coinperps data |
Live markets | 90 (41 crypto, 38 stocks, 6 indices, 4 commodities, 1 pre-IPO) | Coinperps data |
Maximum leverage | 50x on BTC, ETH, S&P 500 and Nasdaq 100 | Coinperps data |
Base trading fee | 0.040% taker, 0.0125% maker | |
Gross fees collected | $4.06 million | Coinperps data |
Liquidity rewards | $75,000 a day | |
Accounts that have traded | 34,775 | Coinperps data |
Open positions that are long | 72.6% | Coinperps data |
The exchange statistics endpoint counts each trade once. As a cross-check we summed daily candles for all 91 markets, including the retired Kioxia contract, and got $18.41 billion, within 0.2% of the official total. Open interest is one-sided and can be set directly against centralised exchange figures.
Polymarket Perps Trading Volume and Trades
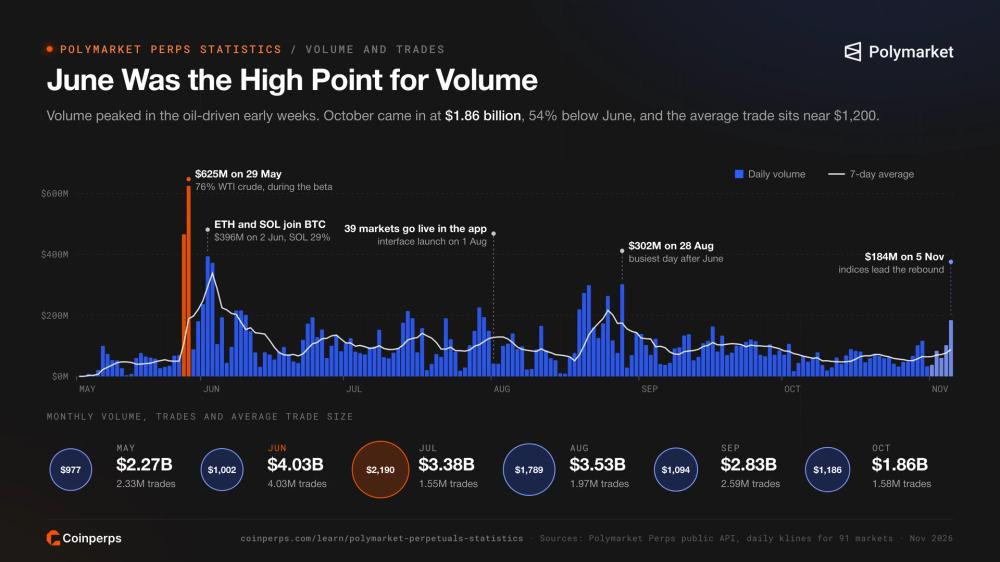
Volume is running at less than half its early pace, and the slide started before the public launch. June, still a beta month, set the record at $4.03 billion. October's $1.86 billion was 54% lower.
Month | Volume | Trades | Average trade |
|---|---|---|---|
May 2026 (from 6 May) | $2.27 billion | 2.33 million | $977 |
June 2026 | $4.03 billion | 4.03 million | $1,002 |
July 2026 | $3.38 billion | 1.55 million | $2,190 |
August 2026 | $3.53 billion | 1.97 million | $1,789 |
September 2026 | $2.83 billion | 2.59 million | $1,094 |
October 2026 | $1.86 billion | 1.58 million | $1,186 |
November 2026 (1 to 5) | $0.47 billion | 0.41 million | $1,191 |
On 29 May the exchange matched $625 million, its biggest day so far. WTI crude made up 76% of it, at a time when Brent was moving about $4 a barrel a day on Strait of Hormuz headlines. Beta accounts sat on the top fee tier, which kept fees that day to about $125,000.
The S&P 500 and Nasdaq 100 contracts drove a pickup in early November. The 5 November session matched $184 million, more than any day since 28 August.
Polymarket Perps Open Interest and Positioning
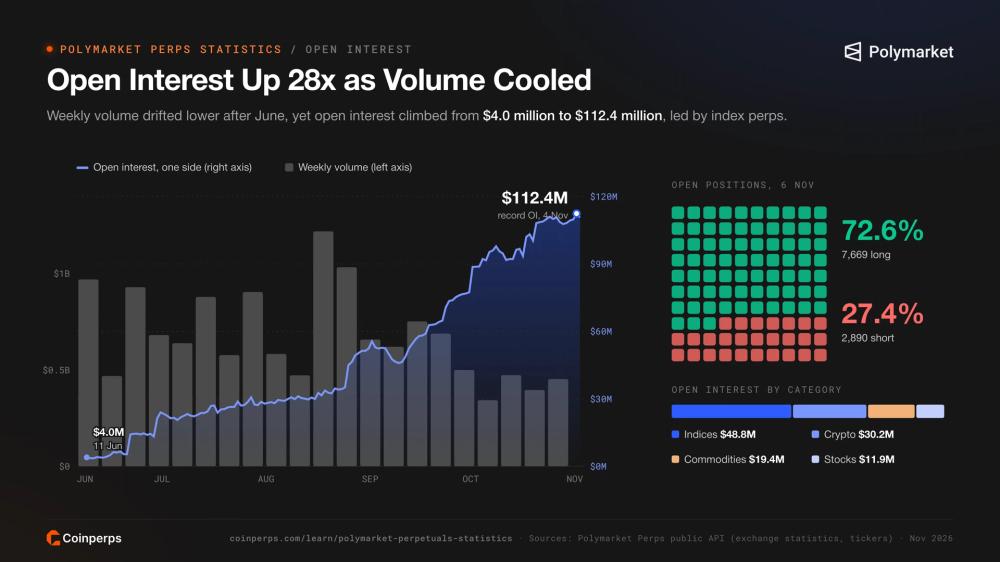
Traders are holding positions for longer. Open interest has grown every month while volume fell, from $4.0 million at the first complete sample on 11 June to a record $112.4 million on 4 November.
Month end | Open interest |
|---|---|
30 June 2026 | $14.4 million |
31 July 2026 | $27.4 million |
31 August 2026 | $50.3 million |
30 September 2026 | $76.0 million |
31 October 2026 | $107.7 million |
5 November 2026 | $110.6 million |
Stock indices hold the largest slice of that money. The S&P 500 contract carries $29.95 million and the Nasdaq 100 another $18.37 million, more than BTC ($13.09 million) and ETH ($11.25 million) put together.
Category | Open interest | Share |
|---|---|---|
Indices | $48.8 million | 44.1% |
Crypto | $30.2 million | 27.3% |
Commodities | $19.4 million | 17.5% |
Stocks | $11.9 million | 10.8% |
Pre-IPO | $0.3 million | 0.3% |
Of 10,559 open positions on 6 November, 7,669 were long and 2,890 short, a 72.6% long share. Brent crude and Zoom were the only markets with more shorts than longs.
Daily volume over the last 30 days averaged about 0.6 times open interest. For a perp venue that is slow turnover, consistent with index and commodity holders sitting on positions instead of scalping them. The Coinperps open interest dashboard tracks positioning live across exchanges.
Which Markets Trade Most on Polymarket Perps
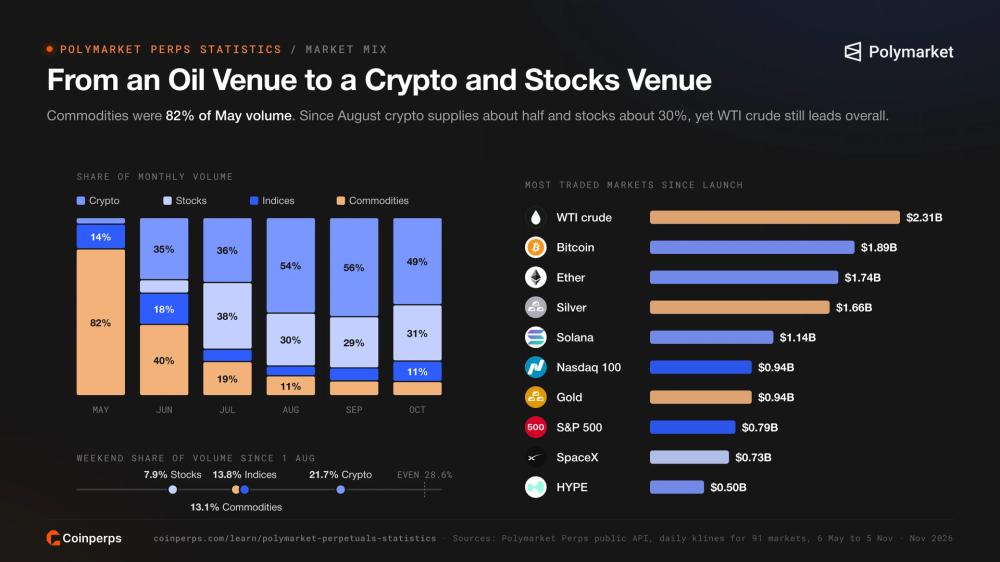
Crypto has replaced commodities as the main source of volume. In May, with only five contracts live, commodities made up 82.4%. Since August crypto has supplied about half of every month.
Month | Crypto | Stocks | Indices | Commodities |
|---|---|---|---|---|
May 2026 | 3.7% | 0% | 13.9% | 82.4% |
June 2026 | 34.9% | 7.5% | 17.6% | 40.0% |
July 2026 | 36.5% | 37.5% | 6.9% | 19.2% |
August 2026 | 53.7% | 29.7% | 5.5% | 11.2% |
September 2026 | 55.7% | 28.8% | 7.3% | 8.3% |
October 2026 | 48.7% | 31.4% | 11.4% | 7.9% |
WTI crude still tops the six-month table at $2.31 billion. Next come BTC at $1.89 billion, ETH at $1.74 billion, silver at $1.66 billion and SOL at $1.14 billion. The Nasdaq 100, gold and S&P 500 each passed $780 million, while the SpaceX contract (SPCX) reached $730 million.
BTC led the last 30 days with 11.5% of volume, followed by ETH at 5.8%, the S&P 500 at 4.3% and the Nasdaq 100 at 4.1%. Among single stocks the chipmakers stand out, with ASML, Arm, SK Hynix and SanDisk all in the top 15 next to a DRAM index. To see where else these contracts trade, compare the best TradFi perpetual exchanges.
Ten featured markets opened the public launch, yet 67 were tradable by the end of that day because batches of 12 and 15 had already been added on 17 and 26 August. Another 16 arrived on 10 September.
In late October Polymarket added its first pre-IPO market, an Anthropic (ANT) contract that went live on 29 October at half the standard fees. One market has closed so far. Kioxia was retired on 28 September at a settlement price of 353.87, with no draw on the insurance fund. Contracts on unlisted assets work differently, as our pre-market perpetuals explainer shows.
Weekends reveal which markets people trade around the clock. Since 1 August, Saturdays and Sundays have carried 21.7% of crypto volume and just 7.9% of single-stock volume. Indices and commodities fall in between at 13% to 14%.
Polymarket Perps Fees, Rewards and Revenue
Trading is cheap at entry level, and the venue pays out more in incentives than it earns in fees. The fee schedule starts at 0.040% for takers and 0.0125% for makers. Above $1 billion of 30-day volume those become 0.020% and a 0.005% maker rebate.
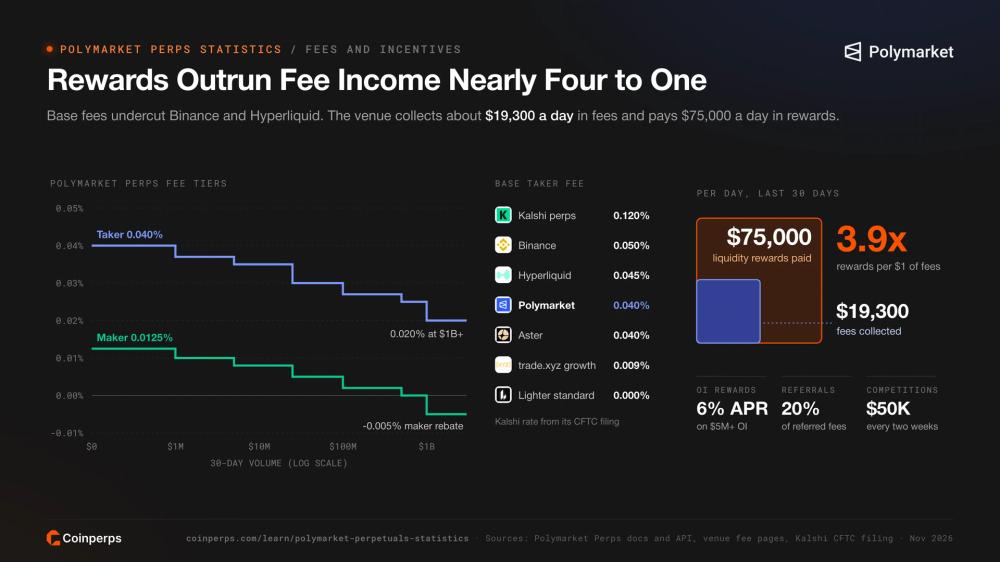
30-day volume | Taker | Maker |
|---|---|---|
$0 | 0.0400% | 0.0125% |
$1 million | 0.0370% | 0.0100% |
$5 million | 0.0350% | 0.0080% |
$25 million | 0.0300% | 0.0050% |
$100 million | 0.0270% | 0.0020% |
$500 million | 0.0250% | 0.0000% |
$1 billion | 0.0200% | -0.0050% |
Since the first fills, gross trading fees add up to $4.06 million. Between May and August the exchange earned about 2.0 basis points per dollar traded. By October that had risen to 2.9 basis points, likely because more volume now pays standard rates instead of the top-tier pricing some beta accounts received.
Apps that send orders through a builder code can charge up to 10 basis points on top. How these rates combine on a single trade is set out in our maker vs taker fees guide.
That income is dwarfed by incentives. The liquidity rewards programme pays $75,000 a day, split evenly across active markets, plus $1,000 on each new market's first day. Fees over the last 30 days averaged about $19,300 a day, so rewards ran at roughly 3.9 times fee income.
Programme | Terms |
|---|---|
Liquidity rewards | $75,000 a day for two-sided quotes within 20 bps of mid |
Open interest rewards | 6% APR on average gross open interest for entities holding at least $5 million |
Referrals | 20% of referred traders' fees, paid weekly |
Trading competitions | $50,000 every two weeks, paid to the top 50 |
Large holders also earn a yield for keeping positions open. The Perps changelog shows the eligibility floor for that reward rising from $1 million to $5 million from 7 September. The first bi-weekly trading competition runs from 2 to 16 November, with $100,000 of volume needed to qualify. Polymarket takes no cut of funding, which passes directly between longs and shorts.
Liquidity, Leverage and Funding on Polymarket Perps
Those rewards buy deep order books on the main contracts. Across three samples on 6 November, the S&P 500 perp averaged $6.71 million of resting orders within 10 basis points of mid and a spread of 0.14 basis points, strong figures for a six-month-old venue.
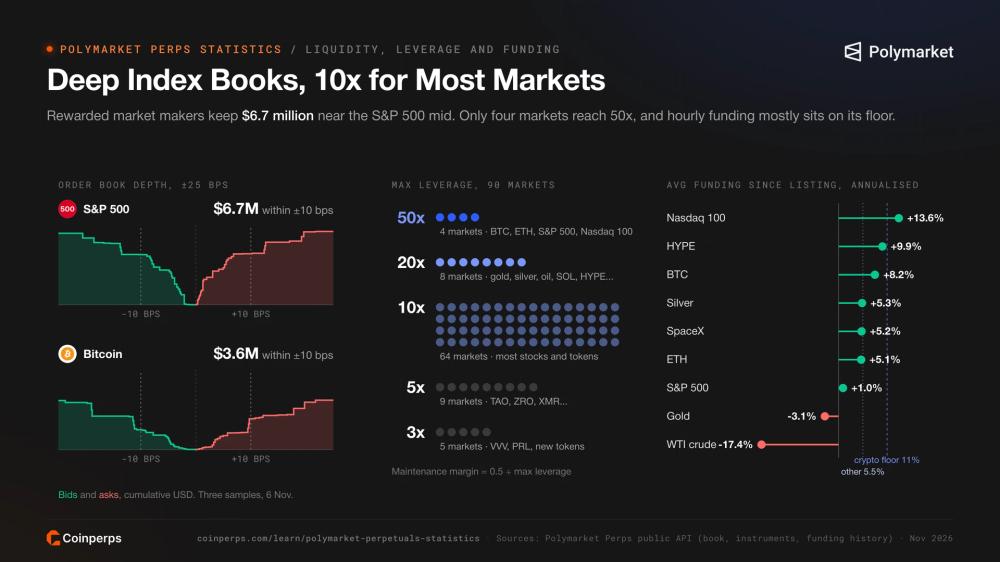
Market | Spread | Depth within ±10 bps |
|---|---|---|
S&P 500 | 0.14 bps | $6.71 million |
Nasdaq 100 | 0.37 bps | $6.52 million |
WTI crude | 1.24 bps | $4.36 million |
Gold | 0.25 bps | $4.33 million |
BTC | 0.13 bps | $3.61 million |
ETH | 0.75 bps | $2.14 million |
SOL | 0.67 bps | $0.91 million |
Anthropic (ANT) | 12.43 bps | $0.02 million |
BTC, ETH, the S&P 500 and the Nasdaq 100 now allow 50x, up from 20x at the public launch. Eight markets, gold, oil, SOL and HYPE among them, go to 20x. Most of the rest (64 of the 90) stop at 10x, and small tokens such as VVV and PRL are capped at 3x. The help pages still give 20x as the maximum. The live instrument data is the better reference.
Only small positions get 50x. On BTC and ETH the cap drops to 25x above $250,000 of notional and reaches 2x above $10 million.
Maintenance margin equals 0.5 divided by the market's cap, half the initial margin at maximum leverage. That works out to 1% on a 50x market. A full-leverage position is therefore liquidated after losing about half its margin.
Funding settles every hour and usually rests on a fixed floor. For crypto the funding formula adds an interest leg of 0.01% per eight hours, about 11% a year, and other markets get half that. Since 29 May BTC funding has sat exactly on the floor in 69% of hours. It was positive in 90% and averaged 8.2% annualised.
Market | Average funding since listing (annualised) |
|---|---|
Nasdaq 100 | 13.6% |
HYPE | 9.9% |
BTC | 8.2% |
Silver | 5.3% |
SpaceX (SPCX) | 5.2% |
ETH | 5.1% |
S&P 500 | 1.0% |
Gold | -3.1% |
WTI crude | -17.4% |
Crude oil breaks the pattern with average funding of -17.4% a year, meaning shorts have paid longs on balance. Single stocks produce the wildest readings. On 6 November SK Hynix stood at +227% annualised and Unitree at -327%. If the sign convention is unfamiliar, read our guide to positive vs negative funding. Rates across exchanges are on the Coinperps funding rates page.
Polymarket Perps Traders and Leaderboard Concentration
Most of the activity comes from a small group of accounts. The public leaderboard lists 34,775 accounts that have traded since the first fills, 8,700 of them so far in November.
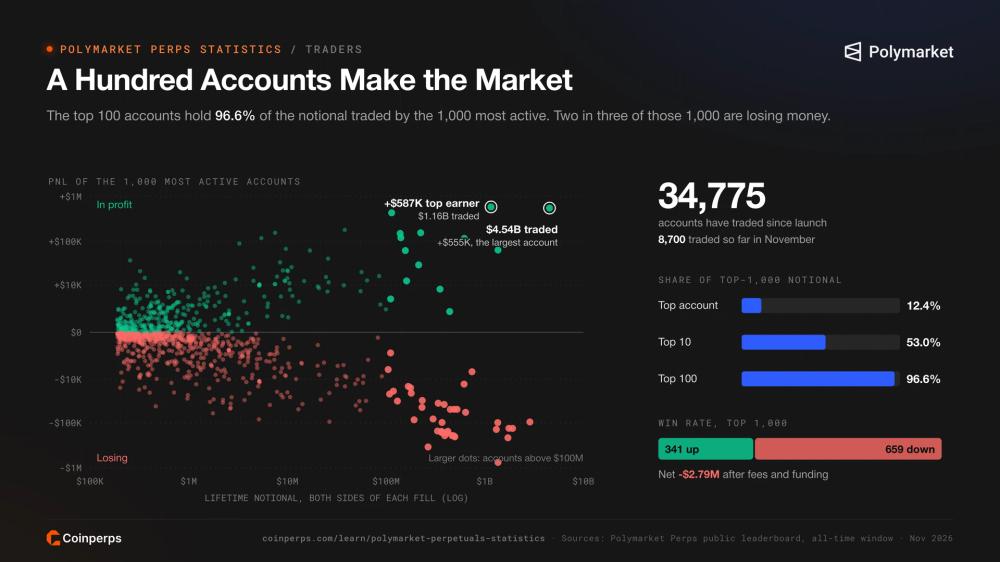
Because the leaderboard counts both sides of every fill, its notional runs at about twice exchange volume. Measured that way, the largest account has traded $4.54 billion, or 12.4% of the total. Among the 1,000 most active accounts, which cover almost all trading, the top 10 hold 53.0% of notional and the top 100 hold 96.6%.
Of those 1,000 accounts, 659 are losing money and 341 are in profit, a 65.9% losing share. Net of fees and funding the group is down $2.79 million, with $4.07 million of gains set against $6.86 million of losses. The top earner is up $587,000 on $1.16 billion of notional.
The likely picture is professional market makers, paid partly through rewards, producing most of the volume while retail traders take the other side. Forced closures on other venues show up in Coinperps liquidation data.
How Polymarket Perps Compares and Where the Risks Sit
Polymarket Perps is still small next to established perp exchanges, and its youth and hybrid design shape the risks. The comparison uses 24-hour figures taken at about 04:15 UTC on 6 November.
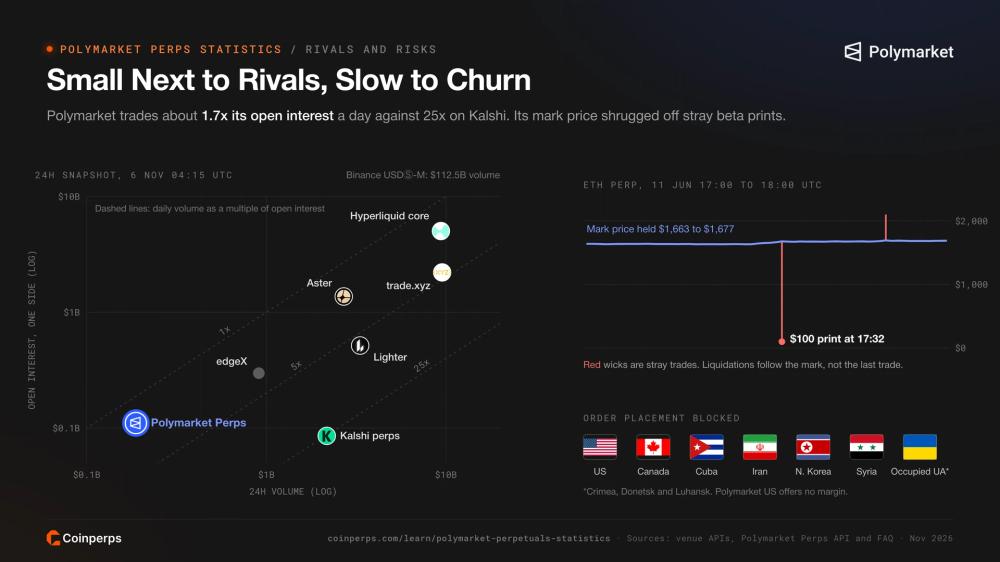
Polymarket Perps vs Other Perp Venues
On Hyperliquid, builder-deployed markets matched about 50 times Polymarket's total daily volume, almost all of it on trade.xyz and mostly in stocks, indices and commodities. Kalshi's US perps began trading in June after the CFTC approved its Bitcoin perpetual. They traded about 11.5 times more than Polymarket yet held less open interest.
Venue | 24h volume | Open interest (one side) |
|---|---|---|
Binance USDⓈ-M futures | $112.5 billion | Not pulled |
Hyperliquid core perps | $9.38 billion | $5.03 billion |
trade.xyz on Hyperliquid | $9.53 billion | $2.21 billion |
Lighter | $3.33 billion | $516 million |
Aster | $2.70 billion | $1.37 billion |
Kalshi perps | $2.17 billion | $85.6 million |
Polymarket Perps | $188 million | $110.6 million |
We halved Hyperliquid's open interest, since its API adds both sides together. In this snapshot Polymarket traded about 1.7 times its open interest and Kalshi about 25 times. When CNBC compared the same ratio on 30 September, it found about 0.75 times on Polymarket's ETH perp, and the experts it spoke to questioned Kalshi's far higher figure.
Perps also trail Polymarket's main business. October's $1.86 billion of perp volume compares with about $2.6 billion of cash traded on its international prediction markets, according to DeFi Rate's tracker. For the trade.xyz side in detail, see our HIP-3 statistics.
Who Can Trade Polymarket Perps
The Perps FAQ blocks order placement from the United States, Canada, Cuba, Iran, North Korea and Syria, plus the Russian-occupied Crimea, Donetsk and Luhansk regions. It is a shorter list than the prediction market's geoblock, though it covers all of Canada.
US residents have no way in. Polymarket US gained a futures commission merchant on 3 November, but it is approved for fully collateralised trading only and cannot offer margin. Separately, Reuters reported on 27 October that the CFTC is again examining whether US users reached the offshore platform. Country-by-country rules are in our guide to crypto perpetual futures regulation.
Price, Custody and Platform Risks
Thin beta books produced some extreme prints. BTC printed $126,570 on 31 May. On 11 June ETH traded at $100 while its mark price held between $1,663 and $1,677. We found no comparable prints on the major markets after mid-July.
That gap between trade and mark is deliberate. Under the mark price rules, the mark is the median of a smoothed book price, local trades and outside feeds, so a single stray fill cannot trigger liquidations.
Index prices come from Pyth, Chainlink Data Streams and Hyperliquid. The changelog records a fix on 14 September for markets priced from Hyperliquid, which had been using that venue's perp mark instead of its oracle price. Oil and stocks were the most affected.
Matching runs offchain. The architecture notes say only deposits, withdrawals and periodic state commitments touch Polygon. Polymarket does not publish the insurance fund's size, and when the fund cannot absorb a failed position, profitable traders on the other side can be closed out through auto-deleveraging. Our guide on how to avoid auto-deleveraging covers how that queue is ranked.
A compromised vendor script drained about $2.7 million from user wallets on 29 October and paused Polymarket's international exchange for about an hour, CNBC reported. Affected users were refunded. No report says whether Perps trading was hit.
The Bottom Line
Six months in, the venue has found a niche in index, commodity and stock contracts, and about $111 million of open interest shows traders are willing to hold positions there. The volume picture is weaker, with October 54% below June and about 100 accounts producing almost all of the activity.
For now the economics rest on incentives. Rewards worth about four times fee income keep the books deep, and organic trading will have to take over that job. If you trade there, size positions to the leverage tiers and keep an eye on funding for single stocks, remembering that the insurance fund is undisclosed. The Coinperps perpetual exchanges list has live comparisons.


